
From prudential concept to operating architecture
1. Climate risk has moved from environmental concern to prudential risk
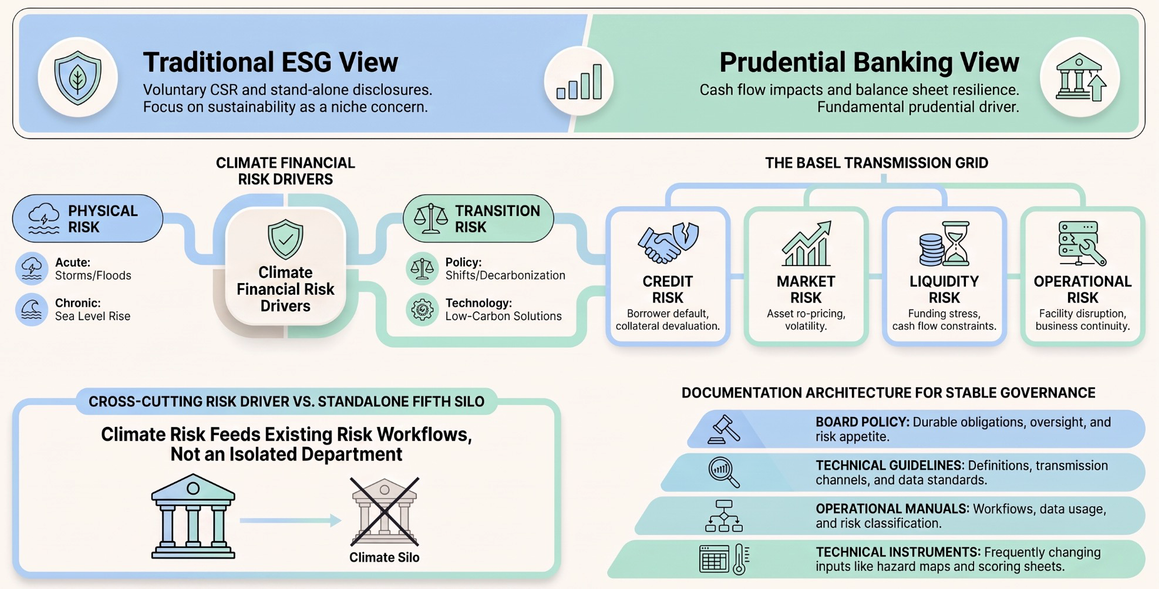
For much of the last decade, climate change entered banking through sustainability reports, environmental and social due diligence, green finance initiatives and corporate responsibility programs. Those activities remain relevant, but prudential thinking has moved further. The core question is no longer only whether a borrower or project creates environmental impact. It is whether climate change, or the economic transition responding to it, can alter cash flow, asset values, probability of default, recovery rates, market prices, liquidity needs, continuity of operations or ultimately the resilience of the financial institution itself. [1] [3]
This change is visible in the international supervisory architecture. The Basel Committee treats climate-related financial risk drivers as capable of translating into established banking risk categories, including credit, market, liquidity and operational risk. Its consolidated climate guidance now sits inside the broader Basel supervisory framework rather than at the edge of voluntary sustainability practice. [1] [4] The 2026 NGFS supervisory guide similarly focuses on practical integration of climate and nature-related financial risks into prudential supervision, with explicit attention to proportionality, adaptation, scenarios and implementation capability. [6]
1.1 Climate is a cross-cutting risk driver, not a fifth silo
The most useful conceptual move is to avoid treating climate as a completely separate financial-risk silo. Physical risks arise from acute events such as floods, storms, wildfires or extreme heat and from chronic shifts such as changing rainfall patterns, water stress or rising temperatures. Transition risks arise from policy, regulation, technology, market demand, energy systems and changes in business models as economies decarbonise. Those drivers then transmit into risks that banks already manage. [1]
That does not mean climate risk should disappear into existing departments. If climate is treated only as a generic driver inside credit, market, liquidity and operational risk, no one may own cross-portfolio aggregation, hazard data, transition analysis, scenario design, climate reporting or methodology governance. The better architecture is therefore climate as a cross-cutting risk driver with explicit governance, rather than climate as a stand-alone fifth risk silo.
1.2 Climate-risk management is not the same thing as ESG, ESRM or disclosure
Environmental and social risk management usually asks whether a transaction or customer creates, is exposed to or inadequately manages environmental and social impacts, legal obligations and stakeholder risks. Climate financial-risk management asks a different but connected question: how could physical and transition climate drivers affect the financial condition of the borrower, the collateral, the exposure, the bank’s own assets or the institution as a whole? The systems should exchange information, but one should not be substituted for the other.
Disclosure is also distinct. IFRS S2, for example, requires disclosure of material climate-related risks and opportunities and the governance, strategy, risk-management processes, metrics and targets associated with them. For financial institutions, it also requires additional information about financed emissions. [10] [11] Those requirements can reinforce internal discipline, but a polished disclosure is not evidence that risk is being managed. Good disclosure should be the external expression of a functioning internal system, not the system itself.
2. What implementation actually looks like inside a bank
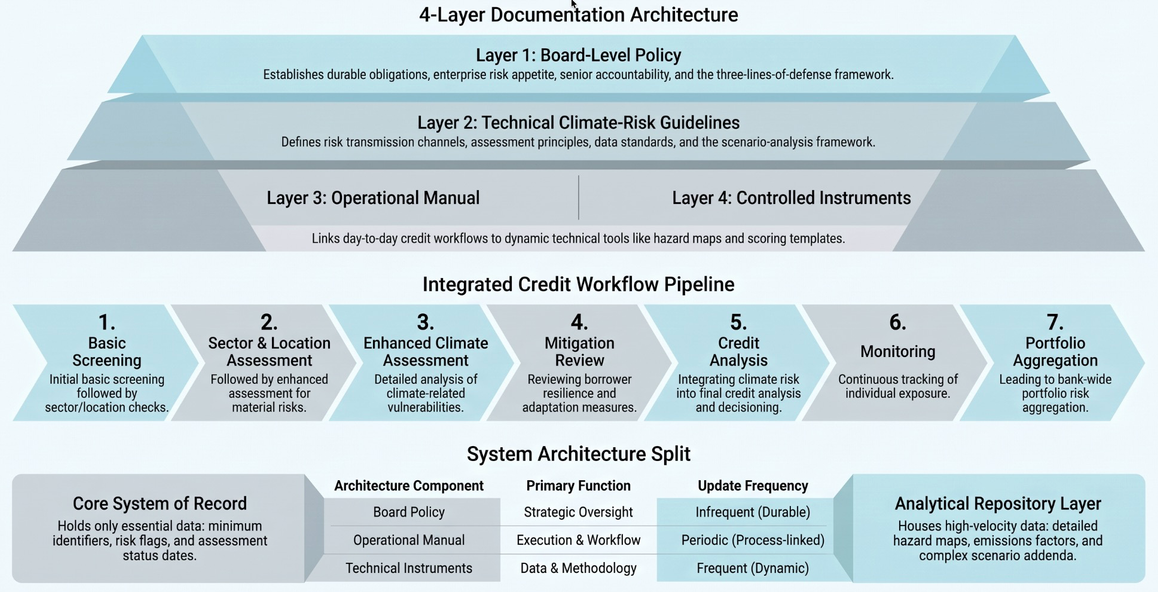
A bank does not implement climate-risk management by issuing one climate policy. The practical task is an institutional integration exercise: governance, documentation, workflows, data, controls, risk appetite, scenario analysis, reporting and operational resilience all have to connect. The most effective architecture is layered so that stable governance remains stable while methods are allowed to evolve.
2.1 A four-layer documentation architecture
| Layer | Typical documentation | What belongs there |
|---|---|---|
| Board-level policy architecture | Enterprise / integrated risk policy, risk appetite statement, and targeted links to existing environmental-social risk policy | Durable obligations: recognition of physical and transition risk, Board oversight, senior-management accountability, three lines of defence, risk appetite, and authority for downstream implementation. |
| Technical climate-risk guideline | Management-approved climate-risk guideline | Definitions, governance, transmission channels, assessment principles, data standards, scenario-analysis framework, monitoring and reporting principles. |
| Operational manual | Process manual used by business, risk, operations, finance and support functions | Who does what, when, using which data, how risk is classified, where evidence is stored, how exceptions are handled, and how reporting works. |
| Controlled technical instruments | Methodology notes, hazard-source register, scoring sheets, data dictionary, scenario parameter sheets and assessment addenda | Frequently changing technical inputs that should not require repeated amendments to Board policy. |
This separation solves a recurring governance problem. A bank should not need to reopen a Board policy every time a flood map changes, an emissions factor is revised, a scenario assumption is improved or a scoring matrix is recalibrated. Board documents should contain enduring responsibilities and principles; controlled technical instruments should absorb most methodological evolution.
The exercise should also be selective. Not every document that contains the words environment, risk or sustainability needs a climate amendment. Credit manuals, stress-testing frameworks, valuation guidance and operational-resilience documents may need targeted changes because they influence actual risk decisions. A CSR policy, a generic green-office guideline or a data standard may already be broad enough for most financial institutions. Good climate implementation is not measured by how many documents are amended. Over-documentation creates conflicting roles, duplicated controls and unnecessary maintenance.
2.2 Governance before modelling
Banks often begin climate programs by searching for a model. The order should be reversed. Before any model can influence a decision, the institution needs governance: Board oversight, senior-management accountability, a management forum or climate-risk committee where appropriate, clear responsibilities across the three lines of defence, escalation routes, data ownership, model controls and internal reporting. Basel is explicit that climate responsibilities should be assigned across the three lines of defence, with the first line identifying risk in activities and client processes, the second line independently assessing and challenging it, and internal audit providing independent assurance. [3]
A climate-risk committee should not become another meeting for its own sake. Its purpose is to connect the functions that own exposures and information – risk, lending, credit risk, operations, finance, environmental-social risk, technology and data – while preserving Internal Audit’s third-line independence. Seniority should be sufficient to obtain information and enforce actions, but membership should be functional rather than excessively large.
2.3 Integrate climate into existing banking workflows – do not build a parallel credit system
Most banks already have policies, guidelines or manuals for credit memorandum, borrower risk grades, environmental and social due diligence, collateral valuation, insurance requirements, site visits, covenants, annual reviews, watch-list processes and portfolio monitoring. Climate-risk management should feed those processes rather than duplicate them.
A proportionate lending workflow can be simple: basic screening -> sector and location assessment -> enhanced climate assessment where material -> mitigation and resilience review -> credit analysis -> monitoring -> portfolio aggregation.
High climate risk should not automatically change delegated credit authority or create a new approval chain unless the institution deliberately decides, based on experience, that such a change is necessary. Climate analysis should inform the decision, not silently rewrite credit governance.
2.4 Minimum system change, richer analytical evidence
Another common implementation mistake is trying to turn the core banking system into a climate database. Climate methodologies are evolving too quickly for that to be sensible. The core system should hold only the minimum identifiers required for reliable aggregation – for example an overall climate-risk classification, an assessment status or date, and perhaps a material climate-sensitive sector flag. Detailed physical hazards, transition drivers, resilience measures, insurance, emissions, data-quality grades, assumptions and overrides can sit in a controlled climate-risk assessment addendum and analytical repository.
This distinction between the system of record and the analytical layer reduces implementation risk. It also makes it easier to upgrade models without repeatedly reconfiguring transaction systems.
2.5 Proportionality and the danger of automatic de-risking
Not every borrower requires the same level of climate analysis. A workable framework uses tiers. Basic screening can apply widely; enhanced assessment can focus on climate-sensitive sectors or locations; detailed analysis can be reserved for large, long-dated, complex or highly exposed transactions; specialist analysis can be used for major infrastructure and project finance. This is consistent with the broader prudential emphasis on proportionality. [6] [13] [15]
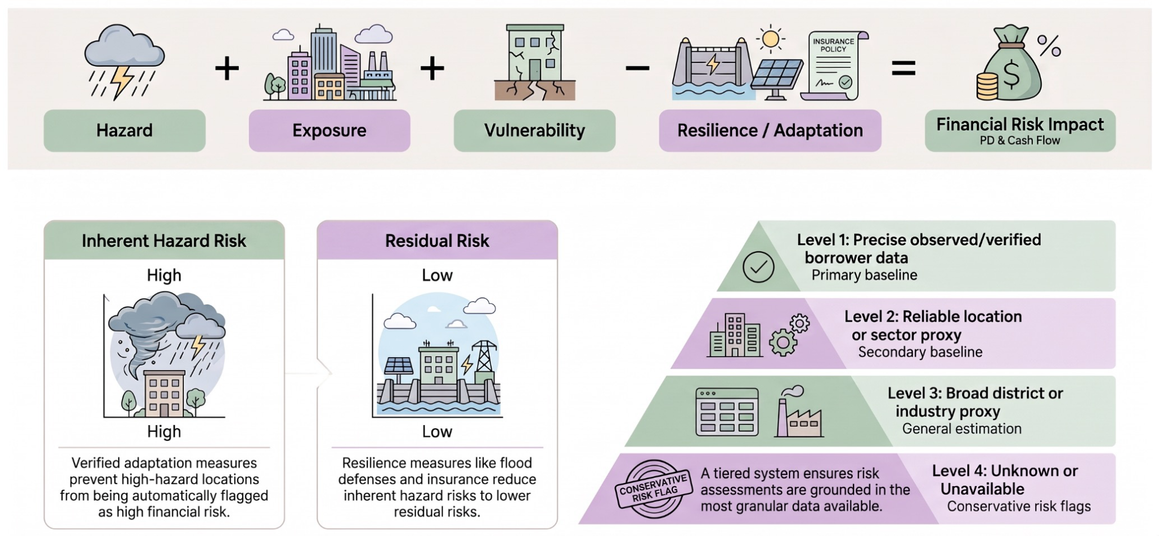
Proportionality also protects against a second error: automatic de-risking. A farmer in a drought-prone district, a hotel in a flood-prone area or a hydropower project exposed to landslides should not automatically be excluded. High inherent climate risk should trigger better analysis of resilience, adaptation, insurance, redundancy, cash-flow protection and contingency planning. A highly exposed but well-adapted borrower may present lower residual risk than a nominally lower-hazard borrower with weak resilience. Risk management should distinguish those cases.
3. Measuring climate risk under imperfect information
3.1 Hazard is not financial risk
Physical climate analysis is often reduced to a hazard map. That is not enough. A flood map identifies the possibility or severity of flooding; it does not directly estimate credit loss. Two assets in the same hazard zone can have very different elevations, construction standards, drainage, insurance, business-continuity arrangements, inventory practices and recovery capacity.
| A useful conceptual chain – not an actuarial formulaClimate financial risk = (Hazard x Exposure x Vulnerability), adjusted for Resilience / Mitigation -> Financial transmission -> Credit / Market / Liquidity / Operational impact. |
The above formula is conceptual rather than mathematically pure. Hazard describes the climate event or chronic shift. Exposure asks what borrower, asset, collateral, facility or revenue stream is in harm’s way. Vulnerability asks how severely it could be affected. Resilience and mitigation reduce residual risk. Only then should the institution translate the result into financial channels such as revenue decline, higher operating cost, collateral impairment, funding stress or operational interruption. [1] [9]
This distinction also creates a better control structure. A bank can separately test whether its hazard source is sound, its exposure data are complete, its vulnerability assumptions are reasonable and its mitigation evidence is verified. If all four are collapsed into one opaque score, model risk increases.
3.2 Physical risk, adaptation and resilience
For physically vulnerable economies, adaptation may be as important as emissions measurement. Adaptation can include flood defences, drainage, slope stabilisation, heat management, irrigation, water efficiency, resilient construction, backup power, geographic redundancy, disaster plans, supply-chain alternatives and insurance. The NGFS has increasingly emphasised adaptation and has proposed metrics that can be used by financial institutions to assess coverage of physical-risk assessment and resilience alignment. [8]
The key prudential insight is that adaptation should be treated as a risk modifier. It should change the residual risk assessment when evidence shows that it reduces loss severity, probability of disruption or recovery time. That prevents the institution from counting adaptation merely as a green-finance label.
3.3 Turning adaptation into trackable metrics
Adaptation becomes decision-useful when it can be monitored over time. The following metrics can support risk appetite, portfolio review, control testing and management reporting. They should be defined carefully and used only where relevant to the portfolio.
| Metric | Illustrative formula | Decision use |
|---|---|---|
| Physical-risk assessment coverage | Relevant exposure with completed physical-risk assessment / relevant exposure | Shows whether the institution understands the risk population. |
| High-risk exposure with adaptation plan | High physical-risk exposure covered by a time-bound, documented adaptation or resilience plan / total high physical-risk exposure | Measures whether high inherent risk is accompanied by action. |
| Adaptation action completion rate | Actions completed by due date / adaptation actions due in the period | Useful control metric for follow-up and escalation. |
| Residual-risk improvement | Exposure-weighted change from inherent physical-risk score to residual risk after verified mitigation | Measures whether adaptation is actually reducing assessed risk rather than merely being documented. |
| Resilient collateral coverage | High-risk collateral with verified relevant resilience measures and/or adequate peril insurance / total high-risk collateral | Connects adaptation to collateral loss severity and LGD. |
| Continuity preparedness | Critical borrowers or own critical assets with tested continuity / disaster-recovery arrangements / total critical population | Links resilience to operational and repayment continuity. |
| Adaptation-finance ratio | New financing whose documented use materially supports physical climate adaptation or resilience / defined relevant new financing base | Tracks the institution’s financing response; denominator must be defined consistently. |
| Post-event recovery performance | Actual recovery time for affected critical operations or selected borrowers versus established recovery objective | Creates a feedback loop from real events into future assumptions. |
These metrics should not all be converted immediately into hard appetite limits. Some are best used first as KRIs or control measures until the bank has enough history to calibrate meaningful thresholds. The distinction between a monitoring metric, a trigger point and a hard appetite limit is essential.
3.4 Transition risk and the proper role of financed emissions
Transition risk is also easy to oversimplify. High emissions are not identical to high credit risk. The financial question is how policy, technology, carbon costs, energy prices, customer demand, market access or product substitution affect a borrower’s economics. Financed emissions can be a useful portfolio lens because they identify where emissions exposure is concentrated, but they should not be treated as a stand-alone credit score.
IFRS S2 requires commercial banking entities to disclose additional information about financed emissions as part of Scope 3 emissions. [10] [11] PCAF provides a widely used industry methodology for measuring financed emissions and its 2025 third edition expanded coverage and guidance. [12] The important governance point is that disclosure methodology and prudential risk methodology can share data, but they need not be identical. A bank may use financed-emissions information to identify transition-sensitive sectors while using different cash-flow, scenario or counterparty analysis to assess financial risk.
3.5 Data quality is a risk attribute, not a footnote
Climate data gaps are not a temporary inconvenience; they are part of the risk architecture. Basel, the NGFS and central banks repeatedly identify data quality, granularity and comparability as major implementation constraints. [2] [9] [17] A useful bank-level hierarchy can distinguish: Level 1 – precise observed or verified borrower/asset data; Level 2 – reliable location or sector proxy; Level 3 – broad proxy such as district or generic industry average; and Level 4 – unknown or unavailable.
The implication is that: missing data should not make risk disappear. A portfolio with poor location data should carry a data-quality warning or conservative treatment, not appear safer because the system cannot map it. Data-quality KRIs should therefore sit beside risk KRIs.
3.6 Model risk and the historical evidence problem
Climate models can generate precise-looking outputs from uncertain inputs. Banks therefore need model governance over data sources, versioning, assumptions, time horizons, proxies, overrides, validation and limitations. Climate models should enter ordinary model-risk discipline rather than sit outside it because they are new.
Historical evidence is also weak because many banks did not tag defaults, restructurings, collateral losses or branch disruptions as climate-related. An institution should therefore begin building a structured climate-event dataset: borrower delinquency after a flood or drought, collateral damage, insurance recovery, operational loss, branch closure, restructuring, recovery cost and recovery time. Over time, those observations become valuable for vulnerability analysis, LGD calibration, business continuity and risk appetite.
4. What a climate Risk Appetite Statement should actually look like
Climate risk appetite is one of the areas where institutions are most tempted to create false precision. A risk appetite statement is useful only when the underlying metric is defined, measurable, owned and connected to action. If a bank cannot yet measure climate-adjusted PD credibly, inserting a precise PD limit into the RAS does not improve risk management.
A practical climate RAS therefore evolves in stages. Early metrics can focus on exposure, assessment coverage, data quality, unresolved high-risk exceptions and mitigation. As methodologies mature, the RAS can add scenario sensitivities, residual-risk measures, financed-emissions indicators and ultimately calibrated financial-loss metrics. Basel’s measurement work explicitly recognises that translation of climate drivers into conventional financial parameters remains methodologically challenging and data-intensive. [2]
4.1 The core structure
A traditional risk appetite table often contains a metric, regulatory limit, risk appetite, trigger point and reporting frequency. Climate risk needs a slightly richer design because definitions and data sources can materially change the result.
| RAS field | Purpose |
|---|---|
| Metric | What exactly is being measured |
| Definition / formula | Numerator, denominator, scope, hazard or sector definition and treatment of missing data |
| Regulatory limit | If one exists; otherwise state that none is prescribed |
| Risk appetite / limit | Maximum or minimum risk level the institution is prepared to accept once calibrated |
| Risk trigger point | Early-warning level below the hard limit or above a required floor |
| Frequency | Monthly, quarterly, semi-annual or annual depending on metric |
| Data source / quality | System, external hazard source, borrower data, proxy and quality grade |
| Owner / escalation | Responsible function and escalation route |
4.2 Four metric families – plus adaptation as a cross-cutting modifier
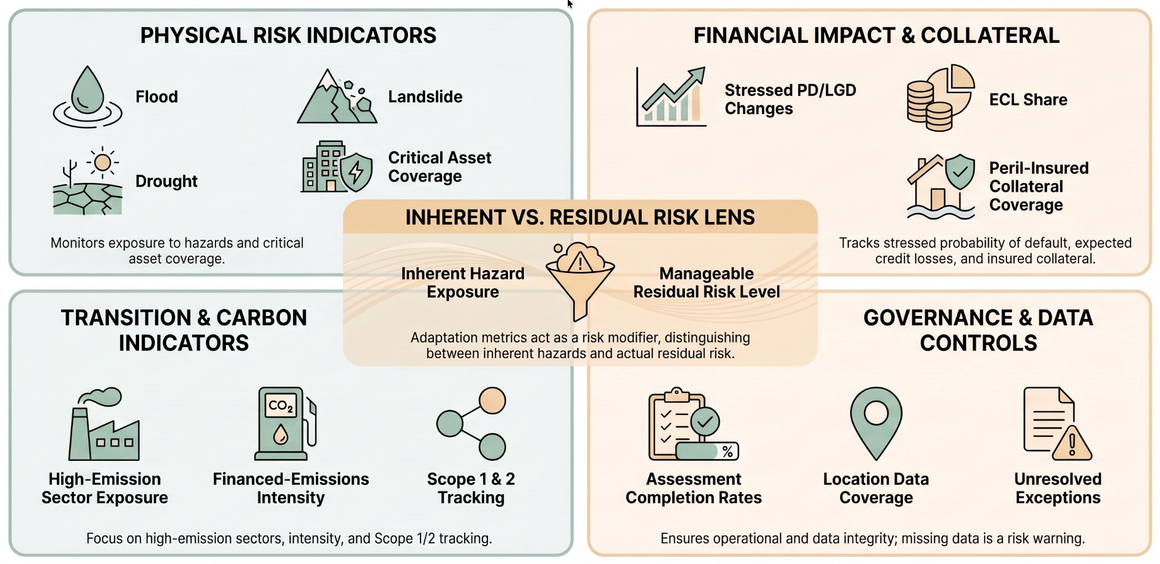
A useful architecture groups climate-risk appetite into four families: physical-risk exposure, financial impact and collateral, transition and carbon exposure, and implementation / data / governance controls. Adaptation and resilience cut across the first two families and should be visible both as mitigation evidence and as trackable metrics.
Physical-risk exposure metrics can include funded exposure in high flood-risk, landslide-risk, drought, extreme-heat or other material hazard zones. Financial-impact metrics can include climate-stressed PD, LGD, ECL, collateral-at-risk and insurance adequacy once methods are defensible. Transition metrics can include exposure to transition-sensitive sectors, financed-emissions intensity and data coverage. Control metrics can include assessment completion, unresolved high-risk exceptions, committee reporting, training and minimum data completeness.
The technical annex to this article provides a detailed illustrative RAS architecture. It deliberately avoids universal numerical thresholds. For many metrics the correct initial entry is monitor / calibrate after baseline, not an invented number. Hard limits should follow evidence, not precede it.
4.3 Adaptation belongs in risk appetite as measurable residual-risk management
Adaptation metrics are particularly useful because they answer a question that hazard maps cannot: what is the institution or borrower doing to reduce the risk? A bank can track the share of high-risk exposure with verified adaptation plans, the completion rate of adaptation actions, the share of critical collateral with relevant resilience measures, the share of critical operations with tested continuity arrangements, and the exposure-weighted improvement from inherent to residual physical risk.
This also improves portfolio decisions. If two borrowers face the same hazard but one has demonstrably stronger resilience, a risk framework should be able to show that difference. A well-designed RAS can therefore monitor both inherent exposure and residual exposure after adaptation, allowing management to distinguish genuine risk reduction from simple risk avoidance.
5. From scenario analysis to financial integration
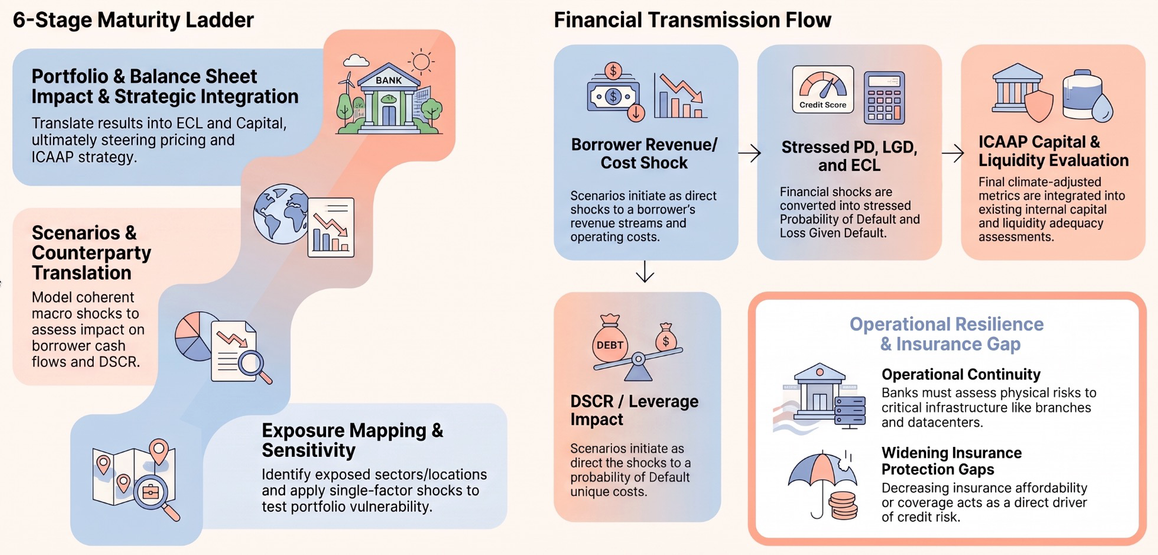
5.1 Stress testing should mature in stages
Climate stress testing is often presented as if institutions should jump immediately to sophisticated long-horizon models. In practice, a maturity path is more credible. The NGFS and EBA both emphasise forward-looking scenario analysis while recognising that methods, data and use cases differ. [7] [14]
| Maturity stage | Primary question |
|---|---|
| Stage 1 – Exposure mapping | Which sectors, locations, assets and counterparties are exposed? |
| Stage 2 – Sensitivity analysis | What happens if a selected revenue, cost, collateral or hazard assumption changes? |
| Stage 3 – Sector / geographic scenarios | How do coherent hazard or transition scenarios affect selected portfolios? |
| Stage 4 – Counterparty financial translation | How do scenario shocks affect cash flow, DSCR, collateral value, PD or LGD? |
| Stage 5 – Portfolio and balance-sheet impact | How do stressed losses affect ECL, NPLs, earnings, capital and liquidity? |
| Stage 6 – Strategic integration | How do results influence risk appetite, pricing, client engagement, portfolio steering, capital planning, liquidity planning and business strategy? |
The point is to gradually upgrade in stages and make progress without pretending that immature inputs already support later stages precision.
5.2 Climate PD, LGD and ECL: useful objective, difficult measurement
Probability of default, loss given default and expected credit loss are attractive because they connect climate risk directly to familiar credit analytics. They are also difficult. Historical default data rarely records a clean climate cause. Climate events interact with leverage, management quality, insurance, government support, sector conditions and macroeconomic shocks. Long-horizon physical and transition scenarios also extend beyond normal credit-model calibration windows.
A sensible progression is therefore: baseline exposure -> vulnerability assessment -> scenario shock -> borrower financial effect -> stressed PD / LGD / ECL -> validation -> eventual appetite calibration.
Where internal evidence is weak, scenario outputs should be labelled as exploratory or management information rather than silently embedded into accounting or regulatory capital. The Basel Committee’s climate FAQs also emphasise that climate risk is captured through the existing Basel framework rather than through a separate new Pillar 1 climate formula. [5]
5.3 Capital and liquidity: integration before arbitrary buffers
Climate change can clearly affect capital and liquidity through existing risk channels. The harder question is whether institutions should hold a separate climate capital or liquidity buffer. International prudential guidance points first toward integration. Basel expects material climate-related financial risks to be incorporated into internal capital and liquidity adequacy assessments and stress-testing programmes where appropriate. [3]
The analytical sequence should therefore be: identify material drivers, assess exposure and vulnerability, run severe but plausible scenarios, estimate effects on losses and cash flows, and then decide whether existing capital, liquidity and management buffers remain adequate. A separate climate buffer may eventually be justified by a regulator or institution, but it should be the conclusion of evidence and policy design, not an arbitrary percentage chosen at the beginning of the exercise.
5.4 Operational resilience, insurance and the protection gap
Climate risk is not confined to the loan book. Floods, heat, storms and related infrastructure failures can interrupt branches, data centres, transport, power supply, communications and staff access. Existing operational-risk, incident-management, business-continuity and disaster-recovery frameworks should therefore tag climate-related events and feed lessons back into physical-risk models.
Insurance matters because it can reduce loss severity, but insured does not mean safe. Banks need to understand relevant perils, limits, exclusions, deductibles, renewal risk, insurer capacity and whether coverage remains affordable as hazards worsen. A widening protection gap can itself become a credit-risk driver. Insurance adequacy should therefore be treated as a risk-control metric, not a binary checkbox.
6. Climate risk cannot be standardised by banks acting independently
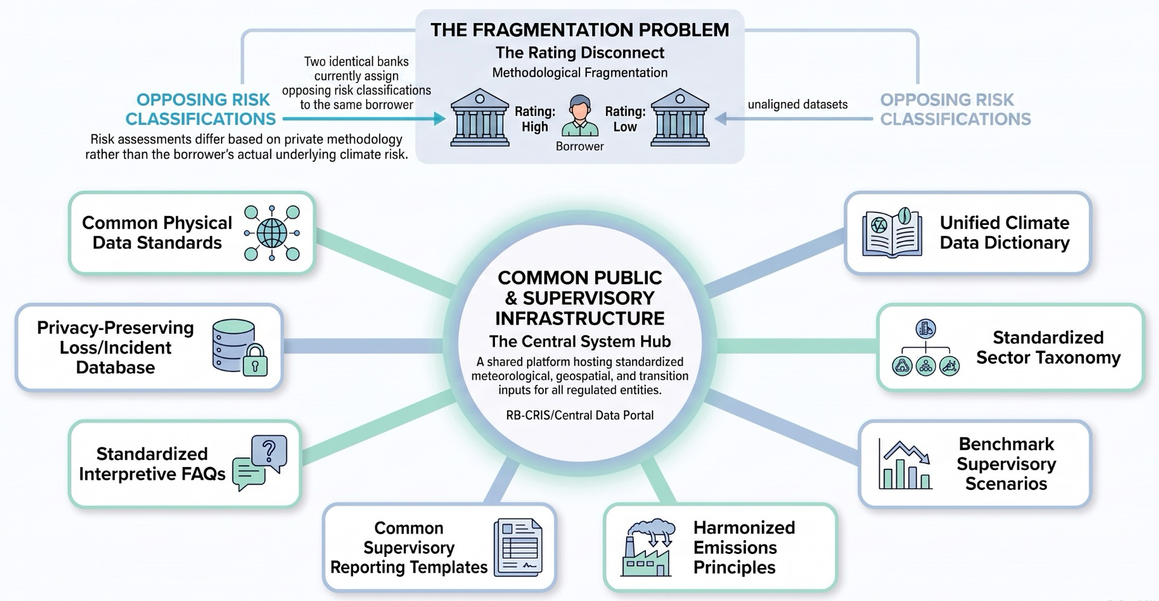
One of the least discussed implementation problems is methodological fragmentation. If every bank independently decides what counts as high flood risk, which hazard map to use, how to classify transition-sensitive sectors, which emissions factor is acceptable, how to treat missing location data and what climate scenario to run, two institutions can assign very different risk results to the same borrower. That may reflect methodology rather than underlying risk.
This is why industry advocacy is necessary. The objective is not weaker standards or collective lobbying against prudential expectations. It is consistent implementation infrastructure that improves comparability, reduces duplicated cost, strengthens supervision and limits methodological arbitrage. The NGFS explicitly supports the exchange of good supervisory practices, while the RBI has highlighted the need for consistency and harmonisation and is developing RB-CRIS to address fragmented climate data. [6] [17] [18]
6.1 A practical consistency agenda
- Common physical-risk data standards: recognised hazard sources, version control, geographic resolution and rules for proxies where precise coordinates are unavailable.
- A common climate data dictionary: minimum fields for location, sector, asset/activity type, insurance, resilience, emissions where relevant, data quality and assessment status.
- A common sector and activity taxonomy: climate-sensitive sectors, transition-sensitive activities, adaptation and mitigation activities, and clear treatment of mixed or transitional activities.
- Benchmark supervisory scenarios: a limited set of common physical and transition scenarios that institutions can supplement with their own internal scenarios.
- Common emissions principles: consistent treatment of reported versus estimated data, attribution, sector proxies, emission factors and data-quality scoring.
- Common supervisory reporting templates: governance, exposure, data quality, residual risk, scenario results, adaptation progress and financial impacts reported in comparable form.
- Implementation FAQs and interpretive guidance: answers to recurring questions such as when detailed borrower assessment is required, how missing location data should be treated, whether climate-adjusted PD is mandatory and what constitutes a climate stress test.
- A privacy-preserving industry loss and incident database over time: aggregated information on climate-related delinquencies, collateral losses, insurance recoveries and operational disruptions can materially improve future calibration.
The RBI’s planned Climate Risk Information System is a useful example of the public-infrastructure logic: rather than each regulated entity assembling incompatible meteorological, geospatial and transition datasets, the central bank proposes a directory and standardised data portal to help bridge physical-risk, transition-risk and emissions data gaps. [17]
6.2 Why consistency is a financial-stability issue
Consistency matters because climate data and methods can influence credit allocation, pricing, provisioning, portfolio limits and supervisory comparison. If one bank classifies an area as high flood risk while another classifies it as low because they use completely different datasets, capital may flow based on methodology rather than risk. Common infrastructure does not eliminate judgement; it creates a common starting point from which judgement becomes more transparent.
The same logic applies to disclosure. Basel’s 2025 voluntary climate disclosure framework explicitly recognises that climate-data accuracy, consistency and quality are still evolving and that multiple quantitative metrics and qualitative information may be needed to form a complete view. [20] Standardisation should therefore improve comparability without creating the illusion that one metric captures the whole risk.
7. A pragmatic implementation pathway for emerging markets
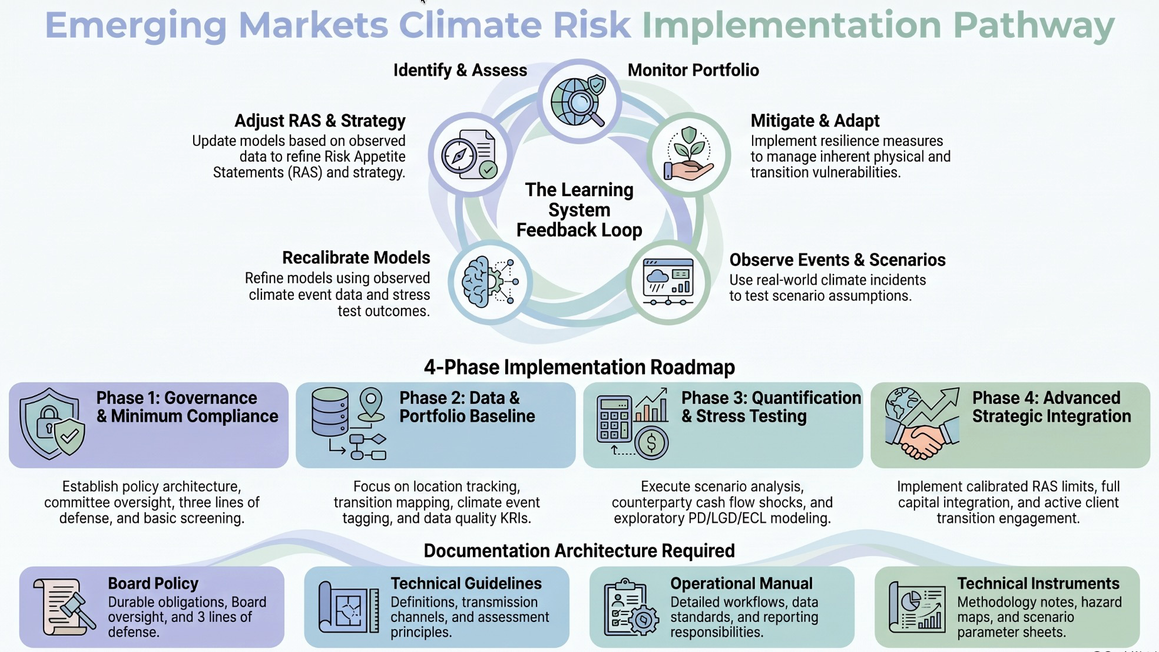
Emerging markets face a difficult combination: physical vulnerability can be high while location data, corporate emissions disclosure, insurance penetration and modelling capability may be weaker. The correct response is neither delay nor false sophistication. It is staged capability building.
7.1 The feedback loop should be explicit
| Climate-risk management is a learning systemIdentify -> assess -> mitigate / adapt -> monitor -> observe incidents and scenario results -> recalibrate methods -> adjust risk appetite -> adjust business strategy. |
Without this loop, climate assessment becomes a one-time classification exercise. With it, real events and portfolio experience improve assumptions, adaptation priorities, risk appetite and strategy.
7.2 Controlled methodological evolution
A bank should expect climate methodologies to change more quickly than ordinary Board policy. That is not governance weakness; it is a reason to design governance correctly. Stable policy should establish obligations and accountability. The technical guideline should define principles and governance. The manual should define the currently approved process. Hazard maps, emission factors, scoring rules and scenario parameters should sit in controlled technical instruments with versioning, approval and audit trails.
This architecture is especially important when supervisory expectations become effective faster than market infrastructure can mature. India’s climate-risk program has used consultation, pilots, data-infrastructure development and a phased disclosure proposal, while Nepal’s 2026 Risk Management Guidelines introduced a dedicated climate-risk chapter into the prudential framework in September 2026 with immediate effect. [16] [17] [19] Different jurisdictions will move at different speeds, but institutions benefit from distinguishing what must be implemented immediately from what requires calibration and research.
7.3 A four-phase implementation roadmap
| Phase | Typical focus |
|---|---|
| Phase 1 – Governance and minimum compliance | Policy architecture, ownership, committee / governance forum, three lines of defense, initial RAS metrics, basic borrower and own-asset screening, reporting and contingency linkage. |
| Phase 2 – Data and portfolio baseline | Location tracking improvement, hazard-source governance, transition-sensitive sector mapping, climate-event tagging, resilience evidence, emissions-data expansion and data-quality metrics. |
| Phase 3 – Quantification | Scenario analysis, sector and geographic stress, stressed borrower cash flows, collateral impacts, exploratory PD/LGD/ECL and capital/liquidity translation. |
| Phase 4 – Advanced integration | Calibrated appetite limits, portfolio steering, client transition/adaptation engagement, mature financial-risk modelling, capital/liquidity integration and connected external disclosure. |
Mature climate-risk management means the institution knows where it is exposed, understands how losses could arise, can explain the quality and limitations of its data, distinguishes inherent from residual risk, uses scenarios, measures whether adaptation works, learns from events and changes decisions when the evidence warrants it.
Conclusion – better banking under structural uncertainty
Climate-risk management should not become a sustainability overlay attached to ordinary banking. Its value lies in improving ordinary banking under conditions of structural uncertainty. The discipline is strongest when it changes what is asked in credit appraisal, how collateral and insurance are reviewed, how physical resilience is measured, how portfolio concentrations are understood, how scenarios are translated into financial consequences, how risk appetite evolves and how operational continuity is protected.
The central implementation lesson is equally practical: start with governance and material exposures; integrate climate into existing processes rather than creating parallel systems; preserve methodological flexibility below Board level; treat data quality as part of the risk result; distinguish hazard from vulnerability and residual risk; measure adaptation; avoid arbitrary climate limits before calibration; and advocate for common industry data, taxonomies, scenarios and reporting infrastructure.
Banks should not wait for perfect data because perfect data will not arrive. They should also not confuse urgency with false precision. The strongest climate-risk framework is progressive, proportionate and evidence-based – and becomes more useful as it learns from the portfolio, from clients, from actual climate events and from the wider financial system.
Illustrative Climate Risk Appetite Architecture
This is only illustrative. It shows how a financial institution can structure climate-related metrics for monitoring, decision-making and eventual RA/RTP calibration. It does not prescribe universal thresholds. Where no regulatory limit exists or the bank lacks a defensible baseline, the appropriate initial treatment is monitoring and calibration rather than invention of a numeric limit.
A1. Physical-risk exposure indicators
| Metric | Illustrative definition / formula | Regulatory limit | Initial RA/RTP treatment | Frequency | Primary data / owner |
|---|---|---|---|---|---|
| Flood-risk exposure | Funded exposure in locations classified as high flood risk / total funded exposure | Usually none specified | Monitor first; calibrate trigger and limit after baseline and scenario analysis | Quarterly | Loan book + approved hazard source / Risk |
| Landslide-risk exposure | Exposure in high landslide-susceptibility locations / total exposure | Usually none specified | Monitor first; calibrate after geographic baseline | Quarterly | Loan book + hazard data / Risk |
| GLOF downstream exposure | Relevant project/infrastructure exposure within defined GLOF impact corridors / relevant exposure base | Usually none specified | Specialist monitoring; calibrate only when methodology is stable | Semi-annual | Project locations + specialist hazard source / Risk & Project Finance |
| Drought / water-stress exposure | Water-dependent sector exposure in high drought/water-stress areas / relevant sector exposure | Usually none specified | Monitor; consider sector-specific trigger after baseline | Quarterly | Sector + location + climate data / Risk |
| Extreme-heat exposure | Exposure materially sensitive to high heat in high-risk locations / relevant exposure | Usually none specified | KRI initially | Quarterly | Sector + location + climate data / Risk |
| Own critical asset physical-risk coverage | Critical owned/occupied sites with completed physical-risk assessment / critical sites | Usually none specified | Set completion floor once inventory is established | Annual / semi-annual | Facilities / Operations / Risk |
A2. Financial-impact, collateral and residual-risk indicators
| Metric | Illustrative definition / formula | Regulatory limit | Initial RA/RTP treatment | Frequency | Primary data / owner |
|---|---|---|---|---|---|
| Climate-stressed PD change | Exposure-weighted stressed PD minus baseline PD for defined climate scenario | Usually none specified | Exploratory until model validated; then consider trigger/limit | Annual / scenario cycle | Credit models + scenarios / Risk & Finance |
| Climate-stressed LGD change | Exposure-weighted stressed LGD minus baseline LGD under defined climate scenario | Usually none specified | Exploratory until model validated | Annual / scenario cycle | Collateral, recovery, insurance / Risk & Finance |
| Climate-stressed ECL share | Incremental ECL under climate scenario / baseline total ECL or relevant portfolio ECL | Usually none specified | Monitor scenario result before hard limit | Annual / scenario cycle | Finance + Risk |
| High-risk collateral with adequate peril coverage | High physical-risk collateral with verified relevant insurance coverage / total high physical-risk collateral | Usually none specified | Can become a minimum control floor | Quarterly | Collateral + insurance data / Credit Admin |
| Residual high physical-risk exposure | Exposure remaining high after verified mitigation/adaptation / high inherent physical-risk exposure | Usually none specified | Potential appetite metric after scoring framework stabilises | Quarterly | Climate assessment addendum / Risk |
| Inherent-to-residual risk improvement | Exposure-weighted reduction from inherent physical-risk score to residual score after verified mitigation | Usually none specified | KRI; use trend and target before hard limit | Quarterly / semi-annual | Climate assessment + mitigation evidence / Risk |
A3. Transition-risk and carbon indicators
| Metric | Illustrative definition / formula | Regulatory limit | Initial RA/RTP treatment | Frequency | Primary data / owner |
|---|---|---|---|---|---|
| Transition-sensitive sector exposure | Exposure to defined transition-sensitive sectors / total relevant exposure | Usually none specified | Monitor concentration; calibrate only after sector taxonomy and strategy are clear | Quarterly | Sector mapping / Risk |
| Financed-emissions intensity | Financed emissions / chosen denominator such as lending amount or borrower revenue, consistently defined | Disclosure requirements may apply by jurisdiction | KRI before limit; track methodology and coverage | Annual / semi-annual | Emissions inventory / Sustainability-Risk-Finance |
| Absolute financed emissions | Attributed financed emissions for covered asset classes | Disclosure requirements may apply by jurisdiction | Monitoring metric, not automatically a risk limit | Annual | Borrower emissions + attribution methodology |
| Operational Scope 1 and 2 emissions | Absolute direct and purchased-energy emissions from own operations | May be disclosure / target requirement | Target metric if institution sets operational target | Annual / quarterly tracking | Facilities + energy / Operations-Finance |
| Emissions-data coverage | Exposure with usable emissions data / exposure in defined emissions measurement scope | Usually none specified | Set minimum data-quality target as capability matures | Annual / semi-annual | Emissions data register / Data owner |
A4. Governance, implementation and data-quality indicators
| Metric | Illustrative definition / formula | Regulatory limit | Initial RA/RTP treatment | Frequency | Primary data / owner |
|---|---|---|---|---|---|
| Climate assessment completion | Applicable exposure with completed climate screening / applicable exposure | May be required by internal framework | Suitable early control floor | Quarterly | Workflow / Business + Risk |
| High-risk mitigation documentation | High-risk exposures with documented mitigation / total high-risk exposures | Usually none specified | Suitable control floor | Quarterly | Climate assessment / Business + Risk |
| Material location-data coverage | Exposure with location data meeting minimum required quality / relevant exposure | Usually none specified | Suitable early data-quality floor | Quarterly | CBS/LMS + addendum / Data owner |
| Climate committee / governance compliance | Required meetings and reporting completed / scheduled requirements | Governance requirement may apply by jurisdiction | Binary / completion control, not exposure limit | Quarterly | Secretariat / Risk |
| Climate training coverage | Relevant staff completing required climate-risk training / relevant staff | Usually none specified | Minimum completion target | Annual / quarterly tracking | HR + Risk |
| Unresolved high-risk exceptions | Count or exposure of overdue climate-risk actions / exceptions | Usually none specified | Trigger based on overdue age / materiality | Monthly / quarterly | Action tracker / Risk |
A5. Adaptation and resilience indicators
| Metric | Illustrative definition / formula | Regulatory limit | Initial RA/RTP treatment | Frequency | Primary data / owner |
|---|---|---|---|---|---|
| Physical-risk assessment coverage | Relevant exposure with completed physical-risk assessment / relevant exposure | Usually none specified | Early minimum coverage target | Quarterly | Risk assessment records / Risk |
| High-risk exposure with adaptation plan | High physical-risk exposure covered by documented, time-bound adaptation or resilience plan / total high physical-risk exposure | Usually none specified | Minimum coverage target once high-risk population is stable | Quarterly | Client plan / Business + Risk |
| Adaptation action completion | Adaptation actions completed by due date / actions due | Usually none specified | Control trigger for overdue actions | Monthly / quarterly | Action tracker / Business + Risk |
| Resilience-adjusted collateral coverage | High-risk collateral with verified resilience measure and/or adequate peril coverage / total high-risk collateral | Usually none specified | Minimum control target | Quarterly | Valuation + insurance + assessment / Credit Admin |
| Continuity preparedness | Critical borrowers or own critical sites with tested continuity/disaster arrangements / critical population | Usually none specified | Minimum control target | Annual / semi-annual | BCP / Operations + Risk |
| Adaptation-finance ratio | New financing with documented adaptation/resilience use or objective / clearly defined relevant new-financing denominator | Taxonomy may apply by jurisdiction | Management / strategy metric before risk limit | Quarterly / annual | Loan purpose + taxonomy / Business + Risk |
| Post-event recovery performance | Actual recovery time versus recovery objective for selected critical operations / borrowers after climate event | Usually none specified | Trigger investigation when objective exceeded | Event-driven | Incident / BCP data / Operations + Risk |
| Residual-risk reduction from adaptation | Exposure-weighted (inherent risk – residual risk after verified adaptation) / inherent risk | Usually none specified | Trend metric; calibrate target after experience | Semi-annual | Assessment model / Risk |
Calibration principles for RA and RTP
- Use a baseline period before setting a limit. A metric that has never been measured should normally begin as a KRI or control metric.
- Define the denominator and scope. Flood exposure as a percentage of total funded credit is not comparable with flood exposure as a percentage of a selected portfolio.
- Separate data-quality triggers from risk triggers. Poor location or emissions data should not be hidden inside the risk score.
- Use scenario analysis and observed incident data to calibrate financial-impact metrics where possible.
- Apply conservative treatment when data are missing, but avoid making the conservative assumption so punitive that it creates automatic exclusion without analysis.
- Review thresholds as methodologies, portfolio mix, regulation and evidence change. The Board should approve appetite changes, while technical definitions should be controlled below Board level where governance allows.
- Do not force every metric into RA/RTP. Some metrics are better maintained as monitoring indicators, targets or controls.
References and further reading
[1] Basel Committee on Banking Supervision, Climate-related risk drivers and their transmission channels (2021)
[2] Basel Committee on Banking Supervision, Climate-related financial risks – measurement methodologies (2021)
[3] Basel Committee on Banking Supervision, Principles for the effective management and supervision of climate-related financial risks (2022)
[4] Basel Committee on Banking Supervision, Climate-related financial risks – consolidated guidance
[5] Basel Committee on Banking Supervision, Frequently asked questions on climate-related financial risks (2022)
[6] Network for Greening the Financial System, Guide for supervisors: Integrating climate and nature-related risks into prudential supervision (2026)
[7] Network for Greening the Financial System, Guide to climate scenario analysis for central banks and supervisors – 2025 version
[8] Network for Greening the Financial System, Integrating Adaptation and Resilience into Transition Plans (2025)
[9] Network for Greening the Financial System, Leveraging physical climate risk data
[10] IFRS Foundation, IFRS S2 Climate-related Disclosures
[11] IFRS Foundation, Transition Implementation Group – financed emissions implementation questions
[12] Partnership for Carbon Accounting Financials, Global GHG Accounting and Reporting Standard Part A – Financed Emissions, 3rd edition (2025)
[13] European Banking Authority, Guidelines on the management of ESG risks (2025)
[14] European Banking Authority, Guidelines on environmental scenario analysis (2025)
[15] Bank of England / PRA, SS5/25 Enhancing banks and insurers approaches to managing climate-related risks (2025)
[16] Reserve Bank of India, Draft Disclosure framework on Climate-related Financial Risks (2024)
[17] Reserve Bank of India, Annual Report 2024-25 – Reserve Bank Climate Risk Information System (RB-CRIS)
[18] Reserve Bank of India, climate risk and the need for consistency and harmonisation across the financial system
[19] Nepal Rastra Bank, Risk Management Guidelines, 2026
[20] Basel Committee on Banking Supervision, A framework for the voluntary disclosure of climate-related financial risks (2025)