
Excess Reserves and the Investment Deficit
Nepal presents a macroeconomic paradox that few frontier economies share. As of mid-January 2026, Nepal Rastra Bank holds USD 22.47 billion in gross foreign exchange reserves – a record high – sufficient to cover 18.1 months of merchandise and services imports against NRB’s own policy target of 7 months [source: NRB Macroeconomic Report, First 6 Months FY 2025/26]. The reserves-to-GDP ratio stands at 53.1%, reserves-to-imports at 150.7%, and reserves-to-M2 at 40.5%, each roughly double the level considered adequate by standard IMF benchmarks.
At the same time, Nepal’s infrastructure financing gap is measured in tens of billions. The energy sector alone requires USD 46.5 billion to meet the 2035 target of 28,500 MW installed capacity [source: IBN Sectoral Profile: Energy]. The National Planning Commission projects NPR 2,554 billion (~USD 20 billion) in infrastructure investment needs over the next 15 years. Committed FDI consistently fails to materialize – the realization rate fell to 15.7% in FY 2022/23, meaning over 84% of approved foreign investment remained undisbursed [source: Nepal Investment Guide 2024].
Former NRB Executive Director Nara Bahadur Thapa described the situation directly: “This is a recession-like situation – full reserves but no investment. If the government is serious about development, financing will not be a constraint.” Economist Keshav Acharya observed that the reserve adequacy of approximately 18 months “clearly indicates the government’s inability to spend and the private sector’s reluctance to invest” [source: The Kathmandu Post, January 10, 2026].
The reserves and the investment deficit are not independent phenomena. They share a common root cause: Nepal’s economy generates foreign exchange (primarily through remittances) faster than it can productively absorb it. Remittance inflows surged 39.1% in the first half of FY 2025/26 to Rs. 1,062.93 billion (~USD 8 billion) [source: NRB Macroeconomic Report]. These dollars flow into the banking system, banks sell them to NRB (because the 30% Net Open Position limit constrains their capacity to hold forex), NRB pays in newly created NPR, and then NRB sterilizes the excess rupee liquidity through reverse repos and deposit collection facilities. The dollars sit in NRB’s foreign securities portfolio earning 4-5% in US Treasuries and Indian T-bills. The NPR sits in the banking system as excess liquidity, with NRB absorbing massive volumes through its Standing Deposit Facility at 3.0%.
This circular flow – remittances → banks → NRB → foreign securities → modest yield – generates neither productive investment nor employment. The hedging facility proposed in this paper represents a mechanism to break this cycle: using the excess reserves as a backstop to absorb the currency risk that prevents foreign capital from financing the infrastructure projects that would generate employment, tax revenue, and economic growth.
Reserve Adequacy Metric | Current Level (Mid-Jan 2026) | Standard Benchmark | Implied Required Reserves | Implied Excess |
Import cover (months) | 18.1 | 7.0 (NRB target) | ~$8.7 bn | ~$13.8 bn |
Import cover (months) | 18.1 | 10.0 (conservative) | ~$12.4 bn | ~$10.1 bn |
Reserves / GDP | 53.1% | 20-25% (adequate) | ~$8.5-10.6 bn | ~$11.9-14.0 bn |
Reserves / M2 | 40.5% | 20% (Greenspan-Guidotti) | ~$11.1 bn | ~$11.4 bn |
Reserves / short-term external debt | Very high | 100% (Greenspan-Guidotti) | ~$0.5 bn* | ~$22.0 bn |
Nepal’s short-term external debt (maturing within one year) is only 1.77% of total external debt [source: PDMO Annual Report FY 2081/82], implying very low short-term external obligations.
By every standard metric, the excess is at minimum USD 10 billion and potentially as high as USD 14 billion. The question is not whether there is surplus, but what to do with it.
2. The Depreciation Risk: 26 Years of Data
Any hedging facility must price and absorb the risk of NPR depreciation against the hedged currency. This section provides the quantitative foundation for that pricing, drawn from 9,562 daily observations of NRB-published exchange rates from January 1, 2000 through April 2, 2026.
Metric | Value |
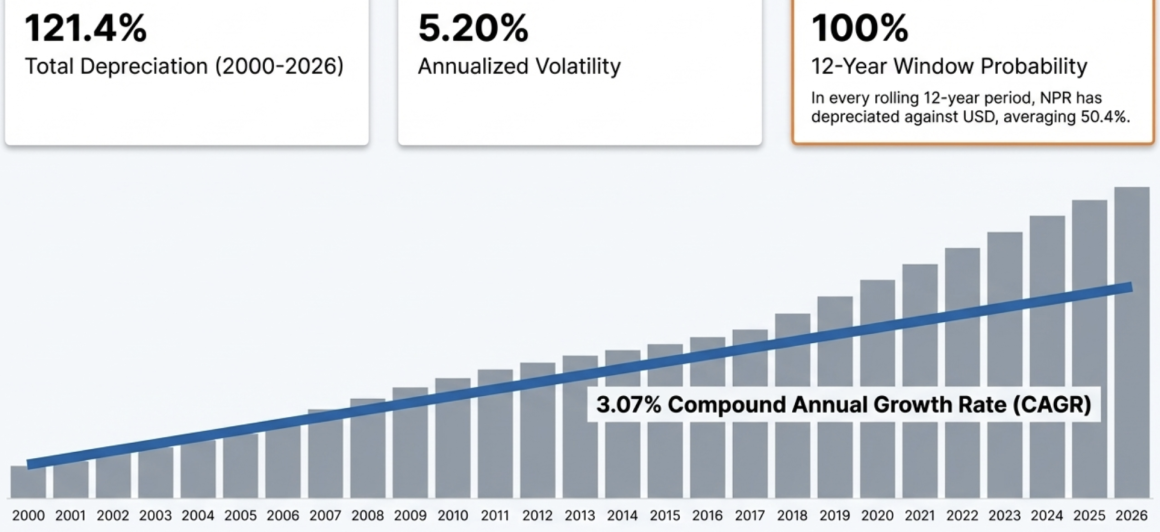
NPR/USD rate, January 2000 | 68.40 |
NPR/USD rate, April 2026 | 151.44 |
Total depreciation | 121.4% |
Compound annual depreciation (CAGR) | 3.07% |
Annualized volatility (daily returns × √252) | 5.20% |
Maximum single-year depreciation | +22.3% (2008) |
Maximum single-year appreciation | -10.4% (2007) |
The 3.07% CAGR is the single most important number for hedging premium pricing. It represents the long-run expected annual cost of holding NPR exposure. Any hedging premium must at minimum equal this rate to break even on expected depreciation over the long term.
Year | Start | End | Avg | Annual Change | Cumulative |
2000 | 68.40 | 73.95 | 70.81 | +8.11% | 8.1% |
2001 | 73.95 | 76.30 | 74.74 | +3.18% | 11.6% |
2002 | 76.30 | 77.75 | 77.66 | +1.90% | 13.7% |
2003 | 77.75 | 73.74 | 75.66 | -5.16% | 7.8% |
2004 | 73.74 | 70.74 | 73.32 | -4.07% | 3.4% |
2005 | 70.55 | 72.57 | 71.13 | +2.86% | 6.1% |
2006 | 72.57 | 70.71 | 72.52 | -2.56% | 3.4% |
2007 | 70.59 | 63.25 | 66.09 | -10.40% | -7.5% |
2008 | 63.25 | 77.35 | 69.41 | +22.29% | 13.1% |
2009 | 77.45 | 74.35 | 77.18 | -4.00% | 8.7% |
2010 | 74.35 | 71.82 | 72.86 | -3.40% | 5.0% |
2011 | 71.44 | 84.99 | 74.30 | +18.97% | 24.2% |
2012 | 84.99 | 87.48 | 85.13 | +2.93% | 27.9% |
2013 | 87.28 | 98.76 | 93.33 | +13.15% | 44.4% |
2014 | 98.59 | 101.12 | 97.32 | +2.57% | 47.8% |
2015 | 100.56 | 105.92 | 102.32 | +5.33% | 54.9% |
2016 | 105.58 | 108.31 | 107.18 | +2.59% | 58.4% |
2017 | 108.31 | 101.90 | 103.90 | -5.92% | 49.0% |
2018 | 101.90 | 111.61 | 109.11 | +9.53% | 63.2% |
2019 | 111.34 | 113.81 | 112.34 | +2.22% | 66.4% |
2020 | 113.92 | 117.00 | 118.27 | +2.70% | 71.0% |
2021 | 116.61 | 118.76 | 117.97 | +1.84% | 73.6% |
2022 | 118.64 | 132.06 | 125.44 | +11.31% | 93.1% |
2023 | 132.06 | 132.84 | 131.84 | +0.59% | 94.2% |
2024 | 132.84 | 136.56 | 133.57 | +2.80% | 99.7% |
2025 | 136.69 | 143.37 | 139.13 | +4.89% | 109.6% |
2026* | 143.50 | 151.44 | 146.21 | +5.53%* | 121.4% |
2026 data through April 2 only.
Depreciation is Not Smooth: The Lumpiness Problem
The annual data reveals a pattern critical for hedging design: depreciation clusters in sharp episodes separated by periods of stability or even appreciation.
Episode 1: Global Financial Crisis (2008). NPR depreciated 22.3% against USD in a single year, driven by the collapse of global financial markets and the INR’s sharp weakening. This was the largest single-year move in the dataset.
Episode 2: Post-crisis INR weakness (2011-2013). NPR depreciated 19.0% in 2011 and 13.2% in 2013, cumulatively moving from 71.44 to 98.76 – a 38.2% depreciation in three years. This was driven by India’s “taper tantrum” and structural current account deficit.
Episode 3: COVID + Russia-Ukraine (2020-2022). From 113.92 to 132.06, a 15.9% depreciation over two years, concentrated in 2022 when the trade deficit hit a record Rs. 1.72 trillion and reserves fell to 6.9 months of import cover.
Episode 4: Recent acceleration (2025-2026). From 136.69 to 151.44 in just 15 months, a 10.8% depreciation driven by the Indian Rupee’s sharp weakening against the USD amid global tariff uncertainties and capital flows.
The clustering pattern has direct implications for hedging facility design. A facility that prices premiums based on the smooth 3.07% CAGR will accumulate surpluses during quiet years and face concentrated payouts during crisis episodes. This creates a liquidity management challenge: the fund must maintain sufficient liquid reserves to meet large payouts during exactly the periods when financial markets are most stressed.
Rolling Period Analysis: Hedging Duration Risk
The Hedging Regulation 2079 permits maximum hedging durations of 7 years (transmission, roads, airports) and 12 years (hydropower, metro, infrastructure). The relevant question for financial feasibility is: what is the probability distribution of cumulative depreciation over these specific time horizons?
Rolling Window | Average Cumulative Depreciation | Maximum | Minimum | Share of Positive Periods |
5 years | 15.8% | 47.5% | -18.6% | ~75% |
7 years | 23.8% | 59.9% | -14.5% | ~82% |
10 years | 38.4% | 62.9% | -2.9% | ~97% |
12 years | 50.4% | 83.9% | 18.3% | 100% |
15 years | 65.6% | 108.8% | 31.1% | 100% |
Calculated from calendar year-end rates, 2000-2025.
The 12-year data is definitive: in every historical 12-year window, the NPR has depreciated against the USD, with a minimum of 18.3% and an average of 50.4%. There is no historical 12-year period where the hedging facility would not have been called upon to make a payout. The facility is not insuring against a low-probability event; it is providing certainty in the face of a near-certain depreciation, with the uncertainty being only about the magnitude.
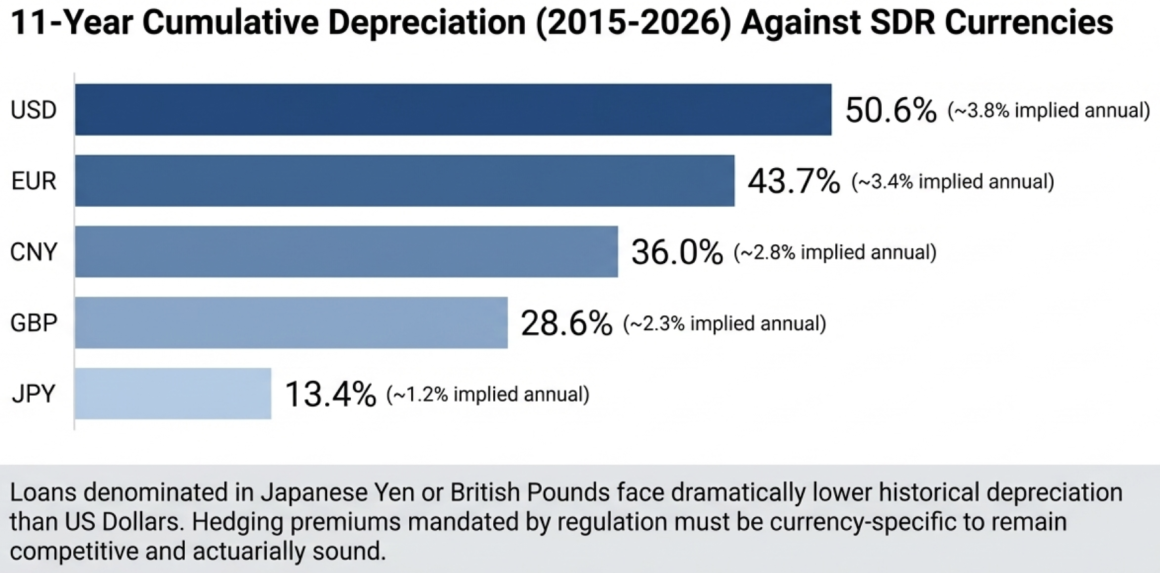
SDR Basket: Differential Depreciation
The hedging regulation restricts coverage to SDR-basket currencies. The NPR has depreciated at different rates against each:
Currency | NPR Rate (2015) | NPR Rate (Apr 2026) | Depreciation (11 years) | Implied Annual Rate |
USD | 100.56 | 151.44 | 50.6% | ~3.8% |
EUR | 122.21 | 175.66 | 43.7% | ~3.4% |
CNY | 16.20 | 22.03 | 36.0% | ~2.8% |
GBP | 156.81 | 201.60 | 28.6% | ~2.3% |
JPY (per 10 yen) | 8.42 | 9.55 | 13.4% | ~1.2% |
The implied SDR-weighted depreciation (using current IMF weights) is approximately 42% over this period, lower than the USD-only figure. This has practical significance: a loan denominated in Japanese Yen faces dramatically lower hedging costs than one in US Dollars. The hedging premium should be currency-specific, not a single flat rate across all SDR currencies.
3. NRB's Balance Sheet
Understanding whether and how NRB’s excess reserves can backstop a hedging facility requires understanding the balance sheet mechanics of reserve accumulation and the monetary policy consequences of reserve deployment.
How Reserves Accumulate
The process begins with remittances. A Nepali migrant worker in Qatar sends USD 1,000 to their family in Nepal through a licensed remittance company. The remittance company deposits this into its account at a commercial bank. The family receives NPR at the bank’s exchange rate (approximately NPR 151,000 at current rates). The bank now holds USD 1,000 with no corresponding dollar liability (the family took NPR). This is unencumbered surplus forex.
If the bank’s net foreign exchange position approaches the 30% NOP limit (30% of primary capital, per NRB Directive 5/081), it must sell the excess. With remittances running at USD 7.5 billion in just the first six months of FY 2025/26 and import demand at USD 6.36 billion (or even lower since not all imports are denominated in USD), the banking system easily generates at least few billions in USD surplus that must flow to NRB.
When the bank sells USD to NRB, two things happen simultaneously. On the asset side, USD moves from the bank’s nostro account at a foreign correspondent bank (e.g., Citibank New York) to NRB’s nostro account. The dollars leave the bank’s balance sheet entirely – this is an outright sale, not a repo or swap. On the liability side, NRB credits the bank’s reserve account at NRB with the NPR equivalent. These NPRs did not exist before; NRB created them. This is new base money entering the domestic monetary system.
NRB’s balance sheet reflects this: as of mid-July 2024, total assets stood at Rs. 2,067.02 billion, of which investments (including gold certificates) constituted 89.23% (Rs. 1,844.30 billion). On the liability side, currency in circulation was 44.79% (Rs. 680.05 billion) and deposits from banks and financial institutions were 43.41% (Rs. 898.17 billion). The balance sheet expanded 30.15% in FY 2023/24 alone, driven by the reserve surge [source: NRB Annual Report FY 2023/24].
The Sterilization Treadmill
The NPR injected when NRB buys dollars creates excess liquidity in the banking system. Left unchecked, this would drive down interest rates and potentially fuel inflation. NRB therefore sterilizes – absorbing the excess NPR through:
• Standing Deposit Facility (SDF) at 3.0%: banks park excess funds with NRB
• Deposit Collection Auctions at 3.0%: NRB conducts auctions to absorb larger volumes
• Reverse Repos: NRB sells government securities to banks temporarily, absorbing NPR
Outright sales of government or NRB securities under NRB Act Section 45
NRB is simultaneously earning 4-5% on the dollars it holds abroad and paying 3.0% on the sterilization instruments domestically. The spread (~1-2%) is NRB’s margin on the reserve accumulation cycle, but it comes at the cost of a continuously expanding balance sheet and growing sterilization liabilities.
The monetary policy implication of a hedging facility is that it does not alter this dynamic on day one. The hedged dollars enter NRB’s reserves just like any other dollar purchase. NRB creates NPR, sterilizes the liquidity, and invests the dollars abroad. The hedging obligation is off-balance-sheet – a contingent liability, not a current one.
What Happens When a Hedge is Called
The critical monetary event occurs at repatriation. When the investor exercises the hedge after 12 years:
Step 1: The investor presents NPR to the hedging institution and demands conversion at the locked rate. Assume USD 100M was hedged at NPR 151/USD. The investor returns NPR 15.1 billion and demands USD 100M.
Step 2: The hedging institution turns to NRB for the exchange facility (as mandated by Rule 18). NRB must provide USD 100M.
Step 3: NRB delivers USD 100M from its reserves. Its dollar assets decreases by USD 100M. The NPR 15.1 billion returned by the investor is absorbed (reducing NPR liabilities).
Step 4: But at the new market rate of, say, NPR 226.50/USD (50% depreciation), the NPR 15.1 billion the investor returned is only worth USD 66.7M at market rates. NRB has given out USD 100M worth of dollars but received back only USD 66.7M worth of NPR. The difference – USD 33.3M – is the real economic cost of the hedge.
On NRB’s balance sheet: dollar assets fall by $100M, NPR liabilities fall by Rs. 15.1 billion. But at the new exchange rate, Rs. 15.1 billion = only $66.7M, so the net balance sheet impact is a contraction of $33.3M. NRB’s equity absorbs this loss (or it is funded from the hedging premium income accumulated in the ring-fenced fund over the hedge’s life). This is where the balance sheet risk lies: the hedge creates a potential asymmetric exposure where NRB’s dollar assets decrease by more than the real value of the NPR it recovers.
Wrong-Way Risk: The Correlation Problem
The most serious risk to the facility is wrong-way correlation. NPR depreciates most during economic crises – precisely when NRB’s reserves are already under pressure. The historical record demonstrates this:
2021/22 crisis: Record trade deficit of Rs. 1.72 trillion, NPR depreciated 6.64% against USD, reserves fell to 6.9 months of import cover (below the 7-month target for the first time in years), remittance growth slowed, and the government was forced to impose import bans on 10 categories of goods and 100% cash margin requirements for 18 import categories [source: NRB Annual Report FY 2021/22; Kathmandu Post reporting].
If hedging payouts had been due during this period, NRB would have faced simultaneous reserve drawdowns from trade-deficit-driven import payments and hedging payout obligations. This is the exact scenario the facility must be designed to survive.
Sizing the Deployment: How Much Is Safe?
The key design question is: how much of the excess reserves can be committed to hedging without jeopardizing NRB’s core reserve adequacy?
A conservative framework would:
1. Define a hard floor at 10 months of import cover (above the 7-month target, providing a 3-month buffer for crisis episodes).
2. Estimate import requirements at approximately USD 15 billion annually (based on recent trends).
3. Calculate required reserves at 10 months: approximately USD 12.5 billion.
Available for hedging backstop: USD 22.47 billion − USD 12.5 billion = approximately USD 10 billion.
4. Apply a utilization cap of 30-50% (not all available surplus should be committed): USD 3-5 billion in hedging commitments.
At the upper bound of USD 5 billion, this would cover the foreign debt component of approximately 10-15 major infrastructure projects simultaneously. Given that the Hedging Regulation restricts eligibility to projects above 100 MW (hydropower) or Rs. 2 billion (other infrastructure), this is a meaningful but not unlimited capacity.
Crucially, the USD 3-5 billion is not disbursed or removed from reserves. It remains invested in NRB’s foreign securities portfolio, earning 4-5% annually. The hedging commitment is a contingent claim on those reserves, exercisable only at repatriation, only to the extent of actual depreciation. The expected annual payout – based on the 3.07% CAGR of depreciation applied to a $5 billion portfolio – would be approximately USD 150-200 million, manageable within NRB’s annual investment income of approximately Rs. 79.79 billion (~USD 530M at current rates).
4. Financial Feasibility: Scenario Modeling
Model Parameters
Parameter | Value | Basis |
Hedged amount | USD 100 million | Representative large hydropower project |
Entry rate | NPR 151/USD | Current rate (April 2026) |
Hedge duration | 12 years | Maximum under Rule 7(2)(kha) |
Annual premium (full lock) | 3.5% | Based on 3.07% CAGR + risk margin |
Annual premium (partial, 25% cap) | 1.0% | Estimated |
NRB treasury yield | 4.5% | Based on 4.96% weighted avg (FY 2023/24) |
Cost-sharing (hydropower) | GoN 5%, NEA 40%, Investor 55% | Rule 5(2) |
Hedge Payout Calculation
The hedging institution’s payout upon repatriation is calculated as:
Hedge Payout = P × (1 − L / M)
Where P = principal, L = locked rate, M = market rate at repatriation.
This formula captures the economic loss to the hedging institution. The investor returns NPR (P × L), but at the new market rate M, those NPR can only purchase P × L / M dollars. The hedging institution must provide the full P dollars, so the shortfall is P − (P × L / M) = P × (1 − L/M).
Note that the payout percentage is always less than the headline depreciation percentage. This is because depreciation is measured as the increase in the exchange rate (a percentage of the old rate), while the conversion loss is measured as the decrease in purchasing power (a percentage of the new rate). These are reciprocals. A 50% increase in the rate (151 → 226.50) translates to a 33.3% loss in purchasing power (1 − 151/226.50). A 100% increase (151 → 302) translates to a 50% purchasing power loss. This asymmetry is structurally favorable to the hedging institution.
Full Rate-Lock Scenarios
Scenario | Depreciation | End Rate | Payout Calculation | Payout | Fee Income (12yr) | Net Hedge P&L | Treasury Income (12yr) | Total Net |
Stability | 15% | 173.65 | $100M × (1 − 151/173.65) | $13.0M | $42.0M | +$29.0M | $54.0M | +$83.0M |
Moderate | 30% | 196.30 | $100M × (1 − 151/196.30) | $23.1M | $42.0M | +$18.9M | $54.0M | +$72.9M |
Expected | 40% | 211.40 | $100M × (1 − 151/211.40) | $28.6M | $42.0M | +$13.4M | $54.0M | +$67.4M |
Historical Avg | 50% | 226.50 | $100M × (1 − 151/226.50) | $33.3M | $42.0M | +$8.7M | $54.0M | +$62.7M |
Adverse | 70% | 256.70 | $100M × (1 − 151/256.70) | $41.2M | $42.0M | +$0.8M | $54.0M | +$54.8M |
Worst Historical | 84% | 277.84 | $100M × (1 − 151/277.84) | $45.7M | $42.0M | -$3.7M | $54.0M | +$50.3M |
Catastrophic | 100% | 302.00 | $100M × (1 − 151/302.00) | $50.0M | $42.0M | -$8.0M | $54.0M | +$46.0M |
Fee income = 3.5% × $100M × 12 years. Treasury income = 4.5% × $100M × 12 years. Simplified model assuming single repatriation at year 12.
The hedging facility is profitable on fee income alone in all scenarios up to approximately 72% cumulative depreciation (the breakeven point where fee income of $42M equals the payout). This covers 6 of the 7 scenarios.
In the worst historical case (84% depreciation), the hedge-only P&L is -$3.7M – a modest loss. When NRB’s treasury income on the hedged reserves is included, the facility is profitable in every scenario, including catastrophic 100% depreciation.
The maximum loss in any scenario, even catastrophic, is $8M on the hedge P&L for a $100M commitment. This is 8% of the notional and well within the treasury income buffer. The facility is structurally viable under the full rate-lock because the combination of premium income and treasury yield substantially exceeds the conversion loss even in extreme scenarios.
Partial Hedge Scenarios (25% Depreciation Cap)
Under a partial hedge, the hedging institution covers only the first 25% of depreciation. If the NPR depreciates beyond 25%, the investor bears the excess.
Scenario | Depreciation | HI Covers (capped at 25%) | Payout | Fee Income (12yr) | Net Hedge P&L |
Stability | 15% | 15% | $13.0M | $12.0M | -$1.0M |
Expected | 40% | 25% (capped) | $16.8M | $12.0M | -$4.8M |
Historical Avg | 50% | 25% (capped) | $16.8M | $12.0M | -$4.8M |
Adverse | 70% | 25% (capped) | $16.8M | $12.0M | -$4.8M |
Worst Case | 84% | 25% (capped) | $16.8M | $12.0M | -$4.8M |
Fee income = 1.0% × $100M × 12 years = $12M. The capped payout under 25% coverage: investor gets conversion at the rate corresponding to 25% depreciation (NPR 188.75), so payout = $100M × (1 − 151/188.75) = $100M × 0.2 = $20M… Let me correct this.
Actually, the cap means the HI converts at the rate implying 25% depreciation from the locked rate: locked rate × 1.25 = 151 × 1.25 = NPR 188.75. Payout = $100M × (1 − 151/188.75) = $100M × 0.200 = $20.0M. But at 15% depreciation (rate 173.65), the actual depreciation is below the cap, so HI covers the full 15%: payout = $13.0M.
Scenario | Depreciation | Rate | HI Covers | HI Payout | Fee Income | Net Hedge P&L | With Treasury |
Stability | 15% | 173.65 | Full (below cap) | $13.0M | $12.0M | -$1.0M | +$53.0M |
Expected | 40% | 211.40 | 25% (capped) | $20.0M | $12.0M | -$8.0M | +$46.0M |
Historical Avg | 50% | 226.50 | 25% (capped) | $20.0M | $12.0M | -$8.0M | +$46.0M |
Adverse | 70% | 256.70 | 25% (capped) | $20.0M | $12.0M | -$8.0M | +$46.0M |
Worst Case | 84% | 277.84 | 25% (capped) | $20.0M | $12.0M | -$8.0M | +$46.0M |
Notes: Hedge Payout = Principal × (1 – Locked Rate ÷ Market Rate) i.e. USD equivalent to depreciation loss on repatriated amount. Maximum HI payout is capped at $20M regardless of depreciation severity. Fee at 1% annual × $100M × 12 years = $12M. Treasury at 4.5% × $100M × 12 years = $54M. Net to HI: Fee Income − Hedge Payout. HI = Hedging Institution. Treasury yield = 4.5% on $100M over 12 years.
Under the partial hedge model, the hedge-only P&L is negative in all scenarios (fee income of $12M never covers even the best-case payout). However, the facility is massively profitable when treasury income is included. The maximum loss on the hedge alone is capped at $8M, and total net income (including treasury) never falls below +$46M.
The cost to the investor is dramatically lower: 1.0% annually versus 3.5%, and with 55% investor share (hydropower), the effective cost drops from 1.925% to 0.55% of the hedged amount. On a $100M project, this is $550,000/year versus $1.925 million – a difference that significantly improves project economics.
The trade-off: The investor bears currency risk beyond 25% depreciation. On a 12-year project where historical average depreciation is 50%, the investor would absorb the 25 percentage points beyond the cap. This is meaningful but predictable, and it can be factored into project financial models at the outset.
Scale Analysis: $3 Billion Hedging Portfolio
Scaling the model to a portfolio of 30 projects with average hedging of $100M each (total $3 billion):
Item | Full Rate-Lock (3.5%) | Partial Hedge (1.0%) |
Annual fee income | $105M | $30M |
12-year cumulative fee income | $1,260M | $360M |
Expected payout (50% dep.) | ~$999M | ~$600M (capped) |
Net hedge P&L | +$261M | -$240M |
12-year treasury income | $1,620M | $1,620M |
Total net income | +$1,881M | +$1,380M |
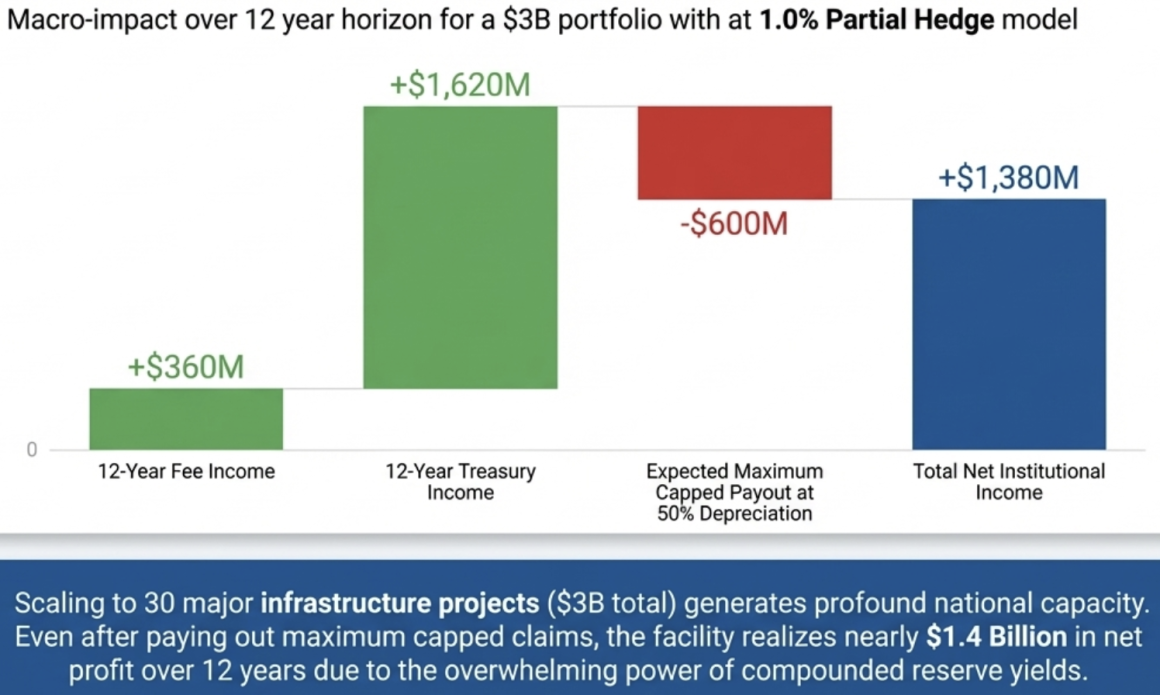
Even under the partial hedge model with a $3 billion portfolio, the facility generates $1.38 billion in total net income over 12 years after paying all hedging claims. The treasury income alone ($1.62 billion) exceeds the maximum hedging payout under the capped model, providing a structural buffer.
5. Risk Architecture
Risk 1: Wrong-Way Correlation
As discussed in Section 3, NPR depreciates most during crises when reserves are already stressed. The 2021/22 episode demonstrated that reserves can fall from 12+ months to below 7 months of import cover within a single year.
Mitigation: The hard floor at 10 months of import cover (USD 12.5 billion), combined with a utilization cap (30-50% of excess), ensures that even if the worst 2021/22-type drawdown coincides with maximum hedging payouts, NRB remains above its 7-month target. Back-testing: if a USD 3 billion hedging portfolio had existed in FY 2021/22, and if all projects simultaneously demanded repatriation during the crisis (an extreme and unrealistic scenario), the maximum payout at 6.64% depreciation would have been approximately $198M – well within NRB’s capacity even during the stress period when reserves were at their lowest.
Risk 2: Remittance Volatility
The excess reserves are driven by remittances, which grew 39.1% in H1 FY 2025/26 but the growth also contracted to 0.5% in FY 2019/20. A sustained remittance decline (due to a recession in Gulf economies, changes in migration policy, or automation of migrant-dependent industries) could erode the reserve surplus.
Mitigation: The hedging facility should have a dynamic cap that adjusts with reserve levels. If reserves fall below 12 months of import cover, new hedging commitments are suspended. If they fall below 10 months, no new hedging is permitted and the existing portfolio is managed on a run-off basis. This rules-based framework prevents overcommitment during periods of temporary surplus. Another approach could also involve annual hedge commitment not exceeding the income that the stock of forex reserve is actually able to earn from the risk free investments.
Risk 3: Maturity Mismatch
Hedging commitments are 7-12 years. Remittance inflows that built the surplus could reverse within 1-2 years. This creates a maturity mismatch: long-dated hedging liabilities against short-duration reserve funding.
Mitigation: The ring-fenced hedging fund (Rule 13) accumulates premium income continuously. Over 12 years, a $100M hedge at 3.5% generates $42M in premiums, building a substantial buffer within the fund itself. The fund should invest these premiums in instruments matching the hedging duration (long-dated bonds, not overnight deposits), creating an internal maturity match. Another approach could be to implement the rolling hedge facility rather than currency hedge locked in for decade long tenures.
Risk 4: Political Risk
Government-directed lending is a persistent risk in state-dominated financial systems. If the hedging institution is pressured to hedge politically favored projects that do not meet Rule 3 criteria or to accept below-market premiums, the fund’s financial viability is compromised.
Mitigation: The separate fund requirement (Rule 13) with separate accounting and NRB oversight (Rule 20) provides some protection. The international triennial evaluation requirement (potentially applicable through the ADF Bill’s Section 49) adds external accountability. However, the strongest mitigation would be international co-investment – if international institutions like TCX or WB co-bears risk, they will insist on commercial pricing and proper due diligence as a condition of participation.
Risk 5: Concentration
Nepal’s infrastructure pipeline is heavily concentrated in hydropower. If the hedging portfolio is dominated by hydro projects, the facility faces sector-specific risk (e.g., drought reducing project revenues and simultaneously triggering repatriation demands).
Mitigation: The hedging institution should impose sector concentration limits (e.g., no more than 60% of the hedging book in any single sector), and should actively seek applications from transmission, transport, and industrial infrastructure projects.
6. International Comparators and Risk-Sharing Partners
The TCX Fund Model
The Currency Exchange Fund (TCX), founded in 2007, provides the most directly applicable international model. TCX hedges over 140 frontier currencies through OTC swaps and forwards, with maturities up to 30 years. It has facilitated over USD 10 billion in local currency funding by 2024 and on-sold USD 5.8 billion in frontier currency risk to private markets.
Critically, TCX completed its first transaction in Nepal in 2023 [source: TCX Impact Report 2023], confirming that NPR is a hedgeable currency within the TCX framework.
Key features of the TCX model relevant to Nepal:
Risk absorption and transfer: TCX absorbs currency risk on its own balance sheet, then transfers approximately 40% to private investors through bond issuances and direct transactions. This risk-recycling mechanism keeps TCX’s net exposure manageable while creating a market for frontier currency risk.
Actuarial pricing: TCX prices hedges commercially based on internal valuation curves. It does not subsidize rates. This maintains financial sustainability – TCX has operated for 18+ years without requiring recapitalization.
Additionality: TCX operates in markets where commercial hedging is unavailable or prohibitively expensive, precisely Nepal’s situation.
Integration pathway: Under Rules 15 and 13(3) of the Hedging Regulation, the domestic hedging institution could enter a back-to-back swap with TCX. The domestic institution provides the hedge to the investor under the regulation, collecting the premium. It then enters a corresponding swap with TCX to transfer the tail risk (e.g., depreciation beyond 25-30%). The domestic institution earns the spread between the premium collected and the premium paid to TCX. TCX takes on the risk it is specialized in managing and can on-sell a portion to private markets. The investor gets a single-counterparty experience under Nepali law. All parties bear the risk they are best equipped to absorb.
World Bank Group Guarantee Platform
The WBG launched its consolidated Guarantee Platform in July 2024, combining MIGA, IFC, and World Bank guarantee products. Nepal is a MIGA member. The platform offers credit guarantees, trade finance guarantees, and political risk insurance, with a target of USD 20 billion in annual issuance by 2030.
While MIGA does not provide currency hedging directly, its political risk insurance can layer on top of a currency hedge to address the complementary risk of expropriation, breach of contract, transfer and convertibility restrictions, and war/civil disturbance. A foreign investor in a Nepali hydropower project with both a currency hedge (domestic facility + TCX) and MIGA political risk coverage would face substantially de-risked exposure.
The Composite Model: The analysis points toward a layered risk-sharing structure:
Layer | Risk Covered | Provider | Instrument | Estimated Cost |
Layer 1 | First 25% of depreciation | Domestic facility (NIFRA) | Rate-lock per Hedging Reg. | 0.75-1.2% annual |
Layer 2 | Depreciation from 25-60% | TCX Fund | Cross-currency swap | Commercially priced |
Layer 3 | Political risk (transfer, expropriation) | MIGA | Political risk insurance | ~0.5-1.5% annual |
Layer 4 | Project credit risk | ADB/IFC partial credit guarantee | Guarantee | ~0.5-1.0% annual |
Under this composite structure, no single entity bears the full currency risk. The domestic facility, backed by NRB’s excess reserves, absorbs the predictable, moderate depreciation band. TCX absorbs the tail risk it specializes in. MIGA covers non-commercial risks. DFI guarantees enhance credit quality. The total cost to the investor may be 2-4% annually across all layers, but the risk is comprehensively covered and distributed among counterparties with the appropriate risk appetite and capacity.
7. The ADF Bill Integration?
The Alternative Development Finance Mobilization Bill 2081 (currently pending re-presentation to Parliament) could provide the optimal institutional vehicle for the reserve-backed hedging facility.
Structural Advantages over the Current Regulation
The ADF Fund would operate under its own special Act, outside BAFIA’s standard framework. This eliminates the NOP constraint – the Fund is not a bank and is not subject to the 30% NOP limit that caps individual bank hedging capacity at USD 48-80 million. With Rs. 10 kharba (~USD 7.5 billion) in authorized capital and Rs. 25 arba (~USD 167 million) in initial paid-up capital, the Fund has a substantially larger base than any individual bank.
Section 25 (Guarantee Fund) creates a dedicated guarantee mechanism backed by GoN and international institution guarantees, directly applicable to hedging backstop. The Fund can combine government guarantees with its own guarantee capacity for joint guarantees (Section 25(4)).
Section 28 (Government-Parity Treatment) would transform hedging-backed instruments from high-risk infrastructure paper to quasi-sovereign securities. Under the NRB Capital Adequacy Framework, GoN-guaranteed ADF bonds would attract 0% risk weight, qualify for SLR compliance (12% of deposits for Class A banks), serve as collateral for NRB’s Standing Liquidity Facility (at 90% of face value), and be exempt from Single Obligor Limits. This creates powerful regulatory demand from banks to hold these instruments.
Section 28(3) (Sector Lending Credit) means bank investment in ADF-issued sector-specific instruments counts toward NRB’s directed lending requirements (10% agriculture, 20% combined energy/MSME/tourism/ICT/export). An ADF Energy Bond would count toward the 20% target, creating regulatory-driven demand from every commercial bank.
Section 8(8) (International Participation) allows international financial institutions to acquire ADF shares with Cabinet approval, creating a direct pathway for IFC, ADB, or bilateral DFIs to become co-owners of the hedging vehicle. This aligns incentives: international institutions with equity stakes in the Fund would actively support its hedging operations with technical assistance, co-guarantees, and market access.
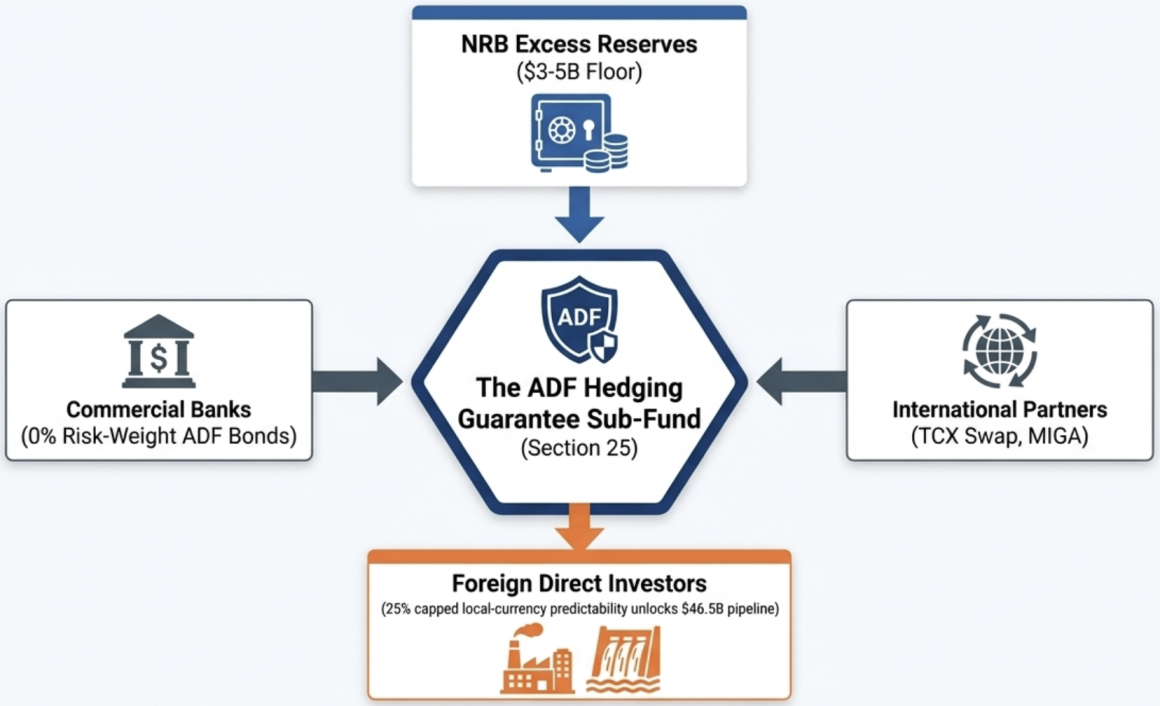
Integration Architecture
If enacted, the ADF could operate the hedging facility as follows:
- The ADF establishes a dedicated Hedging Guarantee Sub-Fund under Section 25, capitalized with a portion of its equity plus GoN guarantee.
- NIFRA (or the ADF itself) is designated as the hedging institution under Rule 6 of the Hedging Regulation 2079.
- The ADF issues Government-guaranteed bonds (Section 28) to raise additional capital for the hedging book from commercial banks (who get SLR credit and 0% risk weight).
- The hedging fund enters back-to-back swaps with TCX for tail-risk transfer under Rule 15.
- Premium income is deposited in the ring-fenced hedging fund (Rule 13), invested in income-generating instruments (Rule 14) with Ministry approval.
- NRB’s excess reserves provide the ultimate backstop for exchange facility provision under Rule 18.
This architecture separates the hedging function from NRB’s core reserve management while maintaining NRB as the provider of last resort for forex liquidity. The ADF absorbs the operational complexity of hedging (pricing, contracting, risk management, reporting) while NRB provides the forex supply when hedges are exercised.