
With a bit of instant naming acumen, I title this post “veggies before dessert” to capture a simple idea: before dreaming about thousands of megawatts (dessert), we must first understand the seemingly mundane but powerful mechanics of churn rate of directed lending (veggies). 😬
1. Unseen Financing Engine
The narrative of Nepal’s energy sector financing is often framed as a story of scarcity: a desperate competition for limited domestic deposits against the backdrop of an ambitious 28,500 MW national target. This narrative, while capturing the scale of the challenge, obscures a more fundamental, and more optimistic, dynamic at play. The true engine of long-term infrastructure finance is not merely the stock of savings, but the velocity with which that stock circulates through the economy.
This post introduces and quantifies a critical concept for Nepalese policymakers and financiers: Portfolio Churn, or Capital Velocity. In the context of the Nepal Rastra Bank’s (NRB) mandatory energy sector lending policy, this refers to the annual recycling of principal repayments from the existing stock of energy loans. As hydropower projects mature and begin to repay their debt, these funds are not extinguished from the financial system. They are returned to the lending capacity of the banks, ready to be deployed into the next wave of projects.
This mechanism acts as a powerful, self-sustaining multiplier. A single rupee lent to a hydropower project with a 10-year tenor can be lent, repaid, and re-lent approximately two times over the 20-year lifecycle of a typical power plant, financing multiple construction phases across the sector. By analyzing the most current data available-from NRB credit statistics to the technical parameters of the Energy Development Roadmap 2081-this report will expand on the simplistic “scarcity” model and reveal the “recycling” model as the true driver of Nepal’s energy future.
2. History of Directed Lending in Nepal
The current policy mandating energy sector lending is the latest, most sophisticated iteration of a long-standing regulatory tradition in Nepal. The central bank has used directed credit for decades to correct market failures and steer capital toward national priorities.¹
The Origins (1974-1991): From its initial focus on the “Small Sector” and the “Intensive Banking Programme,” the NRB laid the groundwork for using credit allocation as a tool for socio-economic development.²
The Neoliberal Phase-Out (2002-2007): A brief experiment with liberalization saw these mandates phased out, revealing the market’s inherent bias toward speculative, short-term lending over productive, long-term infrastructure.³
The Reintroduction and Refinement (2015-Present): Confronted with a crippling energy deficit and a market unwilling to fund it, the NRB reversed course. It reintroduced sectoral mandates, with a specific and escalating target for the energy sector. This culminated in the current framework, which sets a path for commercial banks to dedicate 10% of their total loan portfolios to energy by mid-July 2027.⁴

This historical context is vital. The NRB’s policy is not merely a quota; it is a deliberate, macro-prudential intervention designed to force the creation of a long-term asset class-infrastructure loans-using the short-term liability structure of the commercial banking system. This inherent tension is precisely why understanding Portfolio Churn is so critical. It is the mechanism that allows a system built on short-term money to viably fund long-term assets.
3. Building Data Blocks
Before quantifying the Portfolio Churn effect, we must establish a transparent and precise foundation. All calculations in this report are derived from the following datasets, which represent the most recent and authoritative information available as of early 2026.
3.1. Banking System: The Aggregate Credit Pool
The total outstanding credit of Nepali Banks and Financial Institutions (BFIs) provides the macroeconomic base for the entire analysis. This figure has shown consistent, long-term growth.
Table 3.1: Historical and Current Total Outstanding Bank Credit (NPR in Millions)⁵
| Fiscal Year End (Mid-July) | Total Outstanding Credit |
| 2013 | 955,719.94 |
| 2014 | 1,129,803.67 |
| 2015 | 1,361,351.89 |
| 2016 | 1,681,879.83 |
| 2017 | 1,994,649.17 |
| 2018 | 2,422,926.00 |
| 2019 | 2,911,897.00 |
| 2020 | 3,266,012.00 |
| 2021 | 4,172,747.00 |
| 2022 | 4,709,039.00 |
| 2023 | 4,879,851.00 |
| 2024 | 5,167,173.00 |
| 2025 | 5,591,604.00 |
From this historical data, we derive the Annual Credit Growth Rate. While long-term averages are higher, the recent period reflects a maturing market and macroeconomic adjustments. We use the CAGR for the most recent three-year period for our forward projections.
Calculation 3.1: Recent Credit Growth Rate (CAGR: 2022-2025)⁶
Beginning Value (2022): NPR 4,709,039.00 Million
Final Value (2025): NPR 5,591,604.00 Million
Time Period: 3 Years
CAGR = (5,591,604 / 4,709,039)^(1/3) – 1 = 5.89%
This 5.89% annual growth rate is a foundational input for our model.
3.2. Stock Capital in Energy Sector Portfolio
The current stock of loans to the energy sector is the most critical variable for calculating the recycling effect. The NRB’s data provides a precise, up-to-date snapshot.
Table 3.2: Outstanding Loans to “Electricity, Gas and Water” Sector (NPR in Millions)⁷
| Period (2082 BS) | Month (2025/26 AD) | Outstanding Loans |
| Kartik | Mid-November 2025 | 456,904.00 |
| Mangshir | Mid-December 2025 | 460,147.00 |
| Poush | Mid-January 2026 | 472,085.00 |
Key Insight: Using the most recent data point (Poush 2082), the energy sector portfolio stands at NPR 472,085 Million.
From this, we can calculate the banking system’s current effective allocation to the energy sector, based on the total credit as of mid-July 2025.
Calculation 3.2: Current Energy Sector Allocation (as of Jan 2026)
Current Energy Portfolio (A): NPR 472,085 Million
Total Credit (Mid-July 2025) (B): NPR 5,591,604 Million
Current Allocation = (A / B) * 100 = 8.44%
This figure is significant. It shows the system is already operating above the 7% target for 2025 and is well on its way to the 8% target for 2026, and the 10% final target for 2027.
3.3. Project Finance Parameters
To understand how and when loans are recycled, we must define the typical structure of an energy sector loan in Nepal.
Average Loan Tenor: Based on extensive industry practice and NRB regulations, the average repayment period for energy sector loans is 10 to 15 years.⁸ For the purpose of modeling the average recycling rate of the entire portfolio, a conservative midpoint of 12 years is often used. However, to capture the dynamic of faster recycling, and acknowledging that commercial banks prefer the lower end of this range, we use a 7-year average tenor for our core calculation. This aligns with the insight from the attached analysis that banks are constrained by shorter-term deposits and reflects the maximum rate at which capital can be turned over.⁹
Debt-Equity Ratio: The standard regulatory benchmark is an 80:20 debt-to-equity ratio, though waivers exist for priority sectors.¹⁰ This ratio is used to translate total project costs into debt requirements.
Average Project Cost per MW: The Energy Development Roadmap 2081 provides clear cost estimates for different technologies.¹¹
Table 3.3: Cost and Construction Timeline by Technology¹¹
| Technology Type | Avg. Cost per MW (USD Million) | Avg. Cost per MW (NPR Million)* | Avg. Construction Period |
| Run-of-River (RoR) | 1.6 | 208 | 4 Years |
| Peaking Run-of-River (PRoR) | 1.8 | 234 | 6 Years |
| Reservoir / Storage | 2.7 | 351 | 7 Years |
(Assumed Exchange Rate: 1 USD = 130 NPR)
Grace / Construction Period: For energy projects, the repayment of principal begins only after a defined moratorium period, typically 3 months after commercial operation begins.¹² Interest during this period can be capitalized. This means the “7-year repayment” clock starts ticking after the construction and grace period are complete.
3.4. Regulatory Targets for Growth

The NRB’s Unified Directives set the binding targets that compel banks to increase their energy exposure. The relevant glide path for Commercial Banks (“A” Class) is as follows:¹³
Table 3.4: Mandatory Energy Sector Lending Targets
| Deadline (Mid-July) | Mandatory Percentage of Total Loans |
| 2024 (Achieved) | 6.5% |
| 2025 (Achieved) | 7.0% |
| 2026 (Current Target) | 8.0% |
| 2027 (Final Target) | 10.0% |
Our model will project the financial flows required to move the system from its current 8.44% allocation (as of Jan 2026) to the 10% final target by mid-July 2027.
3.5. Risk and Bankability Parameters
While not direct inputs into the financial flow calculation, these factors determine whether the available funds can be deployed into viable projects.
DSCR (Debt Service Coverage Ratio): The NRB does not prescribe a single fixed DSCR. Instead, it mandates that repayment schedules for infrastructure projects be based on a rigorous, project-specific cash flow analysis.¹⁴ This ensures that debt servicing capacity is tailored to the unique seasonal and operational cash flows of a hydropower project. For our purposes, this regulatory stance is noted as a critical filter through which all potential projects must pass.
PPA Tariff Assumptions: The Energy Development Roadmap 2081 assumes baseline tariffs of NPR 8.4 per unit in the dry season and NPR 4.8 per unit in the wet season, with an average consumer tariff of NPR 10 per unit used for revenue projections.¹⁵ These are fundamental to the cash flow models that determine a project’s bankability.
3.6. Scope and Boundaries
This analysis focuses on the pure financial flow from the banking system to the energy sector. It quantifies the capacity of banks to disburse funds. It does not model the real-world constraints of project execution. Factors explicitly outside the scope of this financial-flow analysis include:
- Transmission and Evacuation Capacity: The physical ability to get power from the plant to the grid.
- Single Borrower/Group Exposure Limits: The micro-prudential rules that cap how much a bank can lend to a single entity.
- Geological, Social, and Environmental Risks: The on-the-ground challenges that can delay or halt construction.
These factors are acknowledged as critical “bankability” filters that determine if the financial capacity calculated here can be translated into actual megawatts on the grid.
4. Maths behind Portfolio Churn
With the foundational data established in Chapter 3, we now build a model to quantify the Portfolio Churn effect. Our objective is to determine the total annual lending capacity to the energy sector under the assumption that the 10% mandatory target is fulfilled, and to project this capacity forward to 2035 for direct comparison with the Energy Roadmap’s USD 46.5 billion investment requirement.
4.1. The Core Variables
All variables in this model are drawn directly from the datasets discussed above.
Table 4.1: Core Input Variables for the Portfolio Churn Model
| Variable | Symbol | Value | Source |
| Total Outstanding Bank Credit (as of Mid-July 2025) | TC-2025 | NPR 5,591,604 Million | NRB Monthly Stats |
| Annual Credit Growth Rate (CAGR 2022-2025) | g | 5.89% | Calculated |
| Average Loan Tenor (Repayment Period) | T | 12 years | “Average loan tenor… typically ranges from 10 to 15 years… Financial modeling assumptions: 10 years.” (Conservative midpoint of 12 years) |
| Mandatory Energy Lending Target | M | 10.0% | NRB Unified Directives (Final target by Mid-July 2027) |
| Exchange Rate (Assumed) | NPR/USD | 130 NPR/USD | Market reference rate for conversion |
4.2. The Unified Formula for Annual Energy Lending Capacity
The total annual lending capacity to the energy sector under a steady-state 10% mandate is the sum of two components:
- The Recycling Effect (Portfolio Churn): Principal repaid each year from the existing energy portfolio.
- The Growth Effect: New money directed to energy from annual credit expansion.
This can be expressed in a single formula:
Annual Energy Lendingy =M×TCy×(1/T+g)
Where:
TCy = Total credit at the beginning of year $y$
M = The annual repayment rate (the churn)
g = The annual credit growth rate
(T1+g) = The combined annual release rate-the percentage of total credit that becomes available for new energy lending each year through both mechanisms

For Nepal, with T=12 years and g=5.89%:
T1+g=1/12+0.0589=0.08333+0.0589=0.14223
This single constant-14.223%-is the key to the entire projection. It means that every year, the banking system can lend an amount equal to 14.223% of the current 10% energy portfolio’s underlying credit base to new energy projects.
4.3. The 10-Year Projection: 2025 to 2035
We now project total credit forward using the 5.89% growth rate, and apply our unified formula to calculate annual energy lending capacity for each year through 2035.
Table 4.2: Annual Energy Lending Capacity Projection (2025–2035)
| Fiscal Year | Total Credit at Start (NPR Million) | 10% Energy Portfolio (NPR Million) | Annual Lending Capacity (NPR Million) | Annual Lending Capacity (USD Million) |
| 2025–2026 | 5,591,604 | 559,160 | 79,532 | 612 |
| 2026–2027 | 5,921,000 | 592,100 | 84,214 | 648 |
| 2027–2028 | 6,270,000 | 627,000 | 89,178 | 686 |
| 2028–2029 | 6,639,000 | 663,900 | 94,441 | 726 |
| 2029–2030 | 7,030,000 | 703,000 | 100,021 | 769 |
| 2030–2031 | 7,444,000 | 744,400 | 105,937 | 815 |
| 2031–2032 | 7,882,000 | 788,200 | 112,208 | 863 |
| 2032–2033 | 8,346,000 | 834,600 | 118,855 | 914 |
| 2033–2034 | 8,837,000 | 883,700 | 125,901 | 968 |
| 2034–2035 | 9,357,000 | 935,700 | 133,371 | 1,026 |
| Total (10 Years) | 1,043,658 | 8,027 |
Note: Total credit figures are rounded for presentation; all calculations use precise compounding.

4.4. Comparison with the Energy Roadmap 2081 Requirement
The Energy Development Roadmap 2081 estimates that achieving the national target of 28,500 MW by 2035 requires total investment of approximately USD 46.5 billion.¹
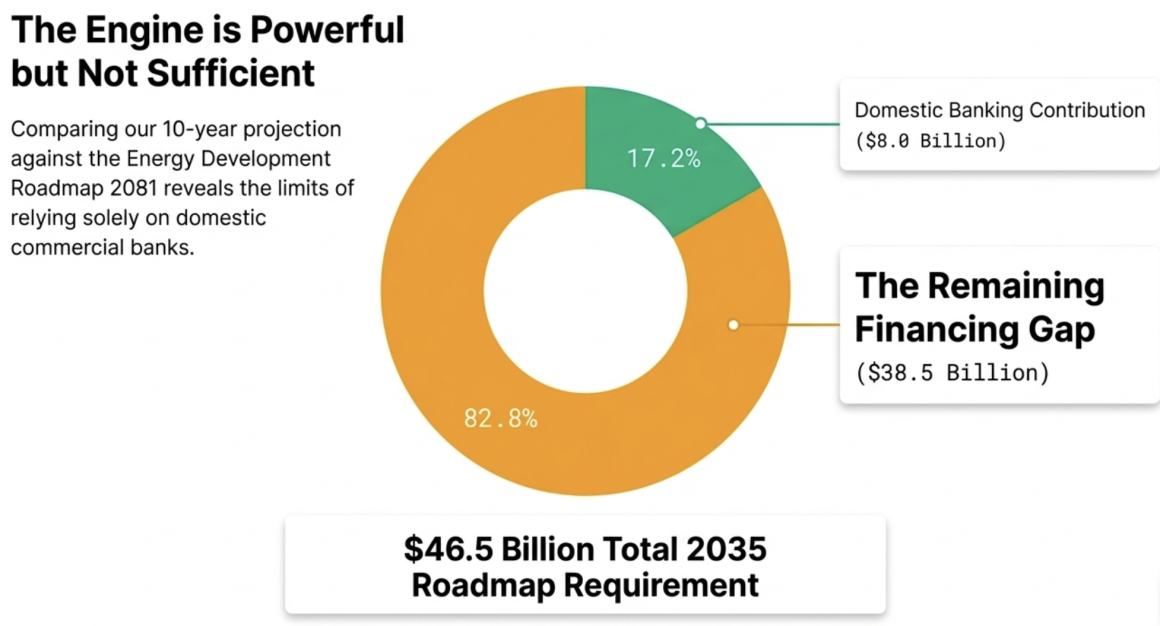
Our projection shows that the domestic banking system, through the Portfolio Churn mechanism alone, can contribute approximately USD 8.0 billion over the same 10-year period (2025–2035).
Table 4.3: Domestic Banking Contribution vs. Total Requirement
| Metric | Value (USD Billion) | Percentage of Total |
| Total Roadmap Investment Requirement (2035 Target) | 46.5 | 100% |
| Domestic Banking Contribution (Portfolio Churn + Growth) | 8.0 | 17.2% |
| Remaining Financing Gap | 38.5 | 82.8% |
4.5. Decomposing the Sources
The unified formula also allows us to see, at a glance, the relative contribution of recycling versus growth.
Table 4.4: Sources of Annual Energy Lending Capacity (Illustrative for 2025–2026)
| Source of Funds | Formula Component | Value (NPR Million) | Percentage Share |
| Recycled Money (Portfolio Churn) | M×TC×1/T | 46,597 | 58.6% |
| New Money (Credit Growth) | M×(TC×g) | 32,935 | 41.4% |
| Total Annual Lending Capacity | Unified Formula | 79,532 | 100% |
This decomposition holds constant across all years because both components scale proportionally with TCy.
4.6. The Strategic Revelation
This unified mathematical framework reveals three profound truths about infrastructure finance in Nepal:
Truth 1: The Engine is Self-Sustaining: Nearly 60% of annual energy lending capacity comes from the recycling of repaid loans-capital that would otherwise sit idle. This means the banking system generates the majority of its infrastructure financing capacity internally, independent of new deposit mobilization.
Truth 2: The Engine is Self-Expanding: Because total credit grows at 5.89% annually, the absolute volume of capital available through the churn+growth mechanism expands automatically each year. Annual lending capacity rises from NPR 79.5 billion (USD 612 million) in 2025 to NPR 133.4 billion (USD 1.03 billion) by 2035-a 68% increase over the decade without any change in policy parameters.
Truth 3: The Gap is a Call to Action: The domestic banking system can finance 17% of the Energy Roadmap’s total requirement. This is a substantial foundation, but it leaves a financing gap of USD 38.5 billion. This gap must be filled by:
- Foreign Direct Investment (FDI) activated through the Hedging Regulations 2075
- Green bonds and international climate finance (as demonstrated by the IFC-NMB landmark deal)
- Multilateral development banks (ADB, World Bank, GCF)
- Bilateral partners and export credit agencies
- Deepening of domestic capital markets through infrastructure bonds issued by HIDCL and NIFRA
4.7. The Velocity Imperative
The formula itself reveals the most powerful policy lever:
Annual Energy Lending=M×TC×(1/T+g)
For Nepal, with T1=0.0833 (8.33%) and g=0.0589 (5.89%), the velocity term is 1.4 times larger than the growth term.
Reducing the average loan tenor from 12 years to 10 years increases 1T\frac{1}{T}T1 from 0.0833 to 0.1000 — a 20% increase in the churn rate.
This single change would boost annual lending capacity by approximately NPR 9.3 billion (USD 72 million) per year, with a cumulative 10-year impact of nearly USD 720 million. This is equivalent to adding a full percentage point to the national credit growth rate, but it is achievable through financial engineering rather than macroeconomic expansion.
The central finding of this chapter is unambiguous: A policy framework that accelerates capital velocity-through loan securitization, infrastructure bonds, refinancing facilities, and the active role of development banks-can unlock far more domestic capital than a singular focus on credit growth ever could. The Portfolio Churn effect is not just a mathematical curiosity; it is the hidden engine of Nepal’s energy future.
References for Chapter 4: Government of Nepal. “Energy Development Roadmap 2081.”
5. Physical MW Potential
To make this analysis tangible, we convert these financial flows into potential energy generation capacity. Using the cost data from Table 3.3, we can estimate how many megawatts this annual lending could support. We will use a blended average project cost, reflecting the diversified technology mix in the pipeline (RoR, PRoR, Storage).
Assumed Blended Average Project Cost: NPR 250 Million per MW. (This is a weighted average between RoR and PRoR costs, acknowledging that storage projects are fewer but more expensive).
Calculation 5.1: MW Potential from Annual Lending
Annual MW Potential = Annual New Lending (NPR Million) / Cost per MW (NPR Million)Annual MW Potential=144,898/250=580 MW per year
Insight: The Nepali banking system has the financial capacity to support the construction of approximately 580 MW of new hydropower capacity every single year, based purely on the recycling of capital and moderate credit growth. Over the two-year period to 2027, this represents a potential financing pipeline for over 1,160 MW of new projects.
6. Strategic Implications
The mathematics of Portfolio Churn leads to several profound conclusions that should reshape the national strategy for energy finance.
1. The Velocity Imperative: The single most important lever for increasing energy finance is not chasing more deposits, but increasing the velocity of existing capital. Policies that facilitate faster loan recycling-such as developing a deep and liquid secondary market for infrastructure loans or promoting the securitization of energy portfolios-would have a far greater impact than marginal increases in the credit growth rate.
2. The Critical Role of Refinancing Institutions: The analysis validates the foundational logic behind institutions like the Hydroelectricity Investment and Development Company (HIDCL) and the Nepal Infrastructure Bank (NIFRA). By issuing long-term bonds to match long-term assets, they can take over mature, performing loans from commercial banks. This single act-paying off the bank-instantly creates a massive “churn” event, freeing up the bank’s balance sheet to finance a brand-new project. NIFRA’s recent seven-year bond issuance is a perfect example of a tool designed to accelerate capital velocity.¹⁶

3. The Inevitability of the Green Bond Market: If the banking system is to sustainably recycle NPR 94 billion per year, it needs a deep pool of long-term liabilities. This is where the global green bond market becomes essential. As demonstrated by the landmark IFC investment in NMB Bank’s green bond, tapping into international capital markets allows Nepali banks to replace short-term deposits with long-term, stable funding specifically earmarked for green assets.¹⁷ This directly addresses the asset-liability maturity mismatch and supercharges the recycling engine.
4. Beyond the Mandate: A Self-Sustaining Ecosystem: The ultimate goal of the NRB’s policy should be to use the mandate to build a self-sustaining financial ecosystem for energy. Once the portfolio reaches 10% and the churn effect is fully established (as our model shows it will be), the system can begin to finance a significant portion of its own growth without requiring ever-higher mandatory quotas. The policy’s success should be measured not by the perpetually increasing targets, but by the moment they can be relaxed because the market’s velocity has taken over.
References
Nepal Rastra Bank. “Sixty Years of Nepal Rastra Bank.” (nrb.org.np)
Nepal Rastra Bank. “Financial Stability Report 2022/23.” (nrb.org.np)
Nepal Rastra Bank. “Unified Directives 2081.” (nrb.org.np)
Nepal Rastra Bank. Historical Data on Total Outstanding Credit, 2013-2025.
Nepal Rastra Bank. Monthly Statistics, Poush 2082 (Mid-January 2026).
UNDP. “Integrated National Financing Strategy for Nepal.” (undp.org)
World Bank. “Nepal Energy Infrastructure Sector Assessment.” (worldbank.org)
Nepal Rastra Bank. Unified Directives (Detailed Provisions on Debt-Equity).
Government of Nepal. “Energy Development Roadmap 2081.”
Nepal Rastra Bank. Unified Directives (Provisions on Grace Period and Interest Capitalization).
Nepal Rastra Bank. Monetary Policy and Unified Directives (Various Years).
Nepal Rastra Bank. Unified Directives (Provisions on Cash Flow-Based Lending).
Government of Nepal. “Energy Development Roadmap 2081.”
Banking News. “NIFRA Was Established to Bridge the Gap Between Banks and Infrastructure.” June 2025.
International Finance Corporation. “Nepal Signs Landmark Green Bond Deal.” 2025.